Plot Vectors and Graphs
approvedby nicoletanyt
Generates graphs and vectors.
★ 12 stars↓ 1,420 downloadsUpdated 1y agoMIT
Obsidian Graph & Vector Plot Plugin
This plugin integrates FunctionPlot to use LaTeX to plot multiple graphs or vectors in Obsidian for better visualisation in Math and Physics concepts
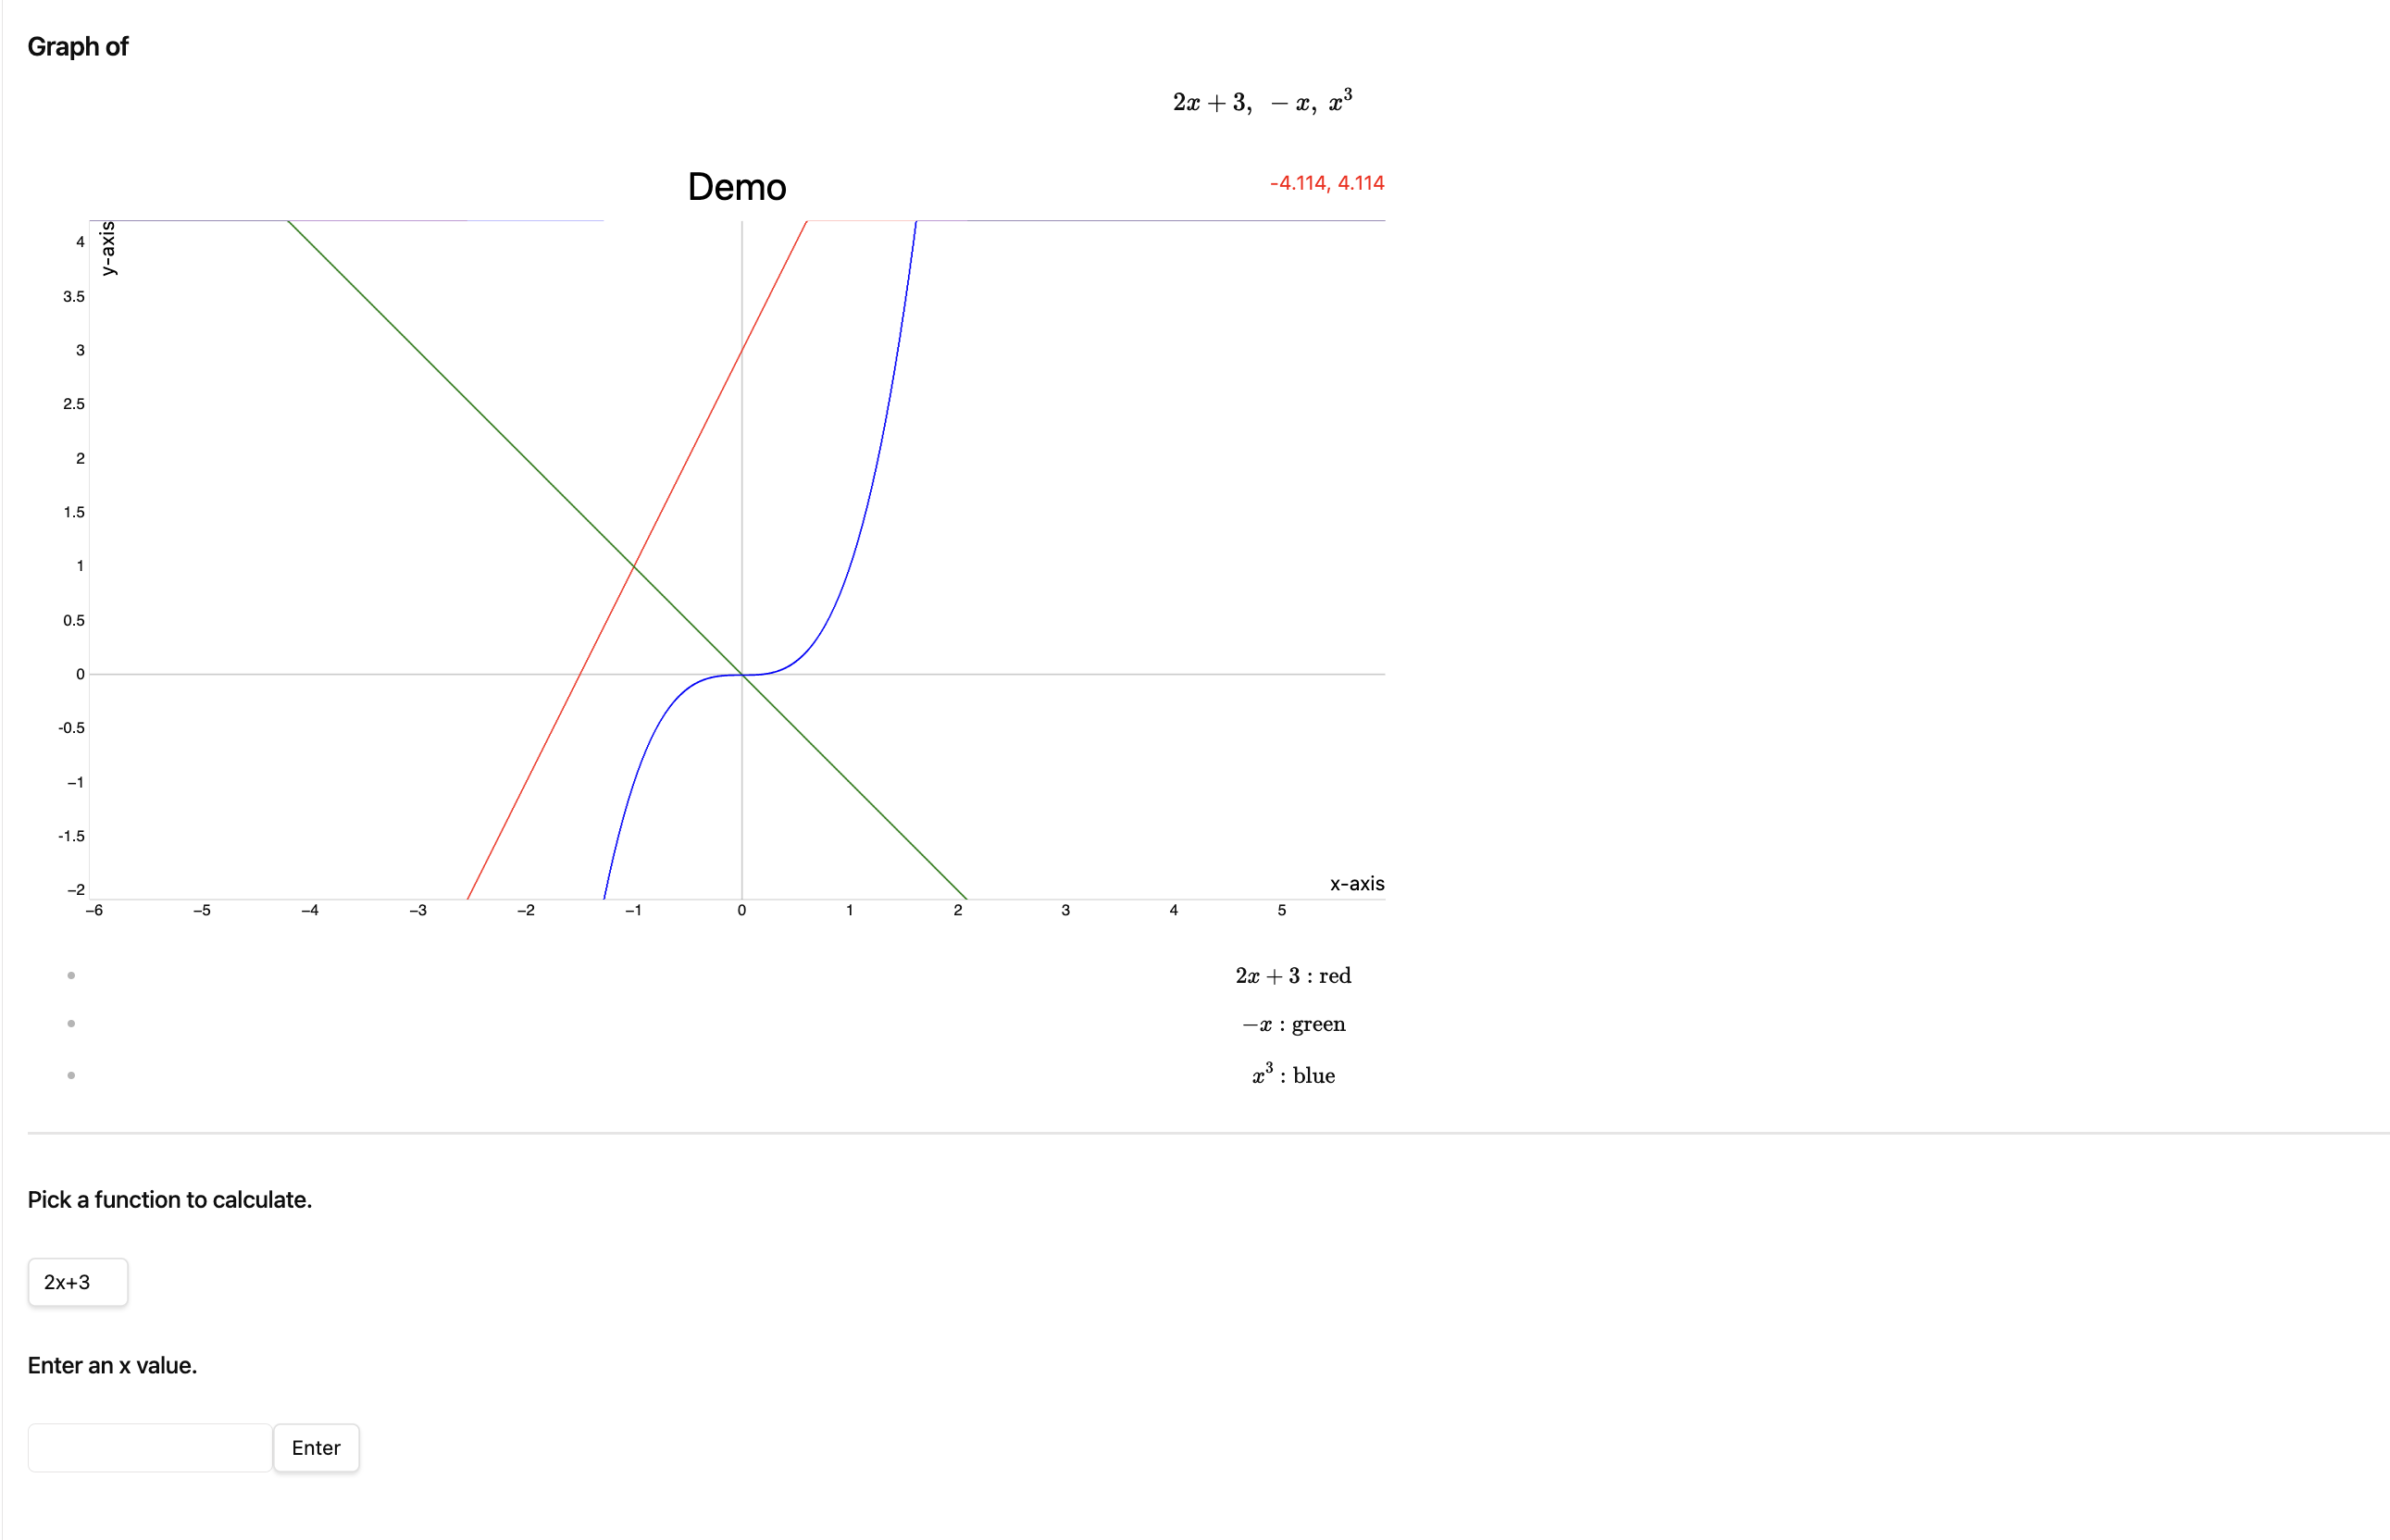
Generating Graph
- Select a LaTeX equation (with or without the $ is fine)
- Use the command "Generate Graph" to generate the graph
- A new page will be opened with the function to plot, the graph, a function to calculate the value of y of the function given its x value, and colour coding of the graphs
- Demo:
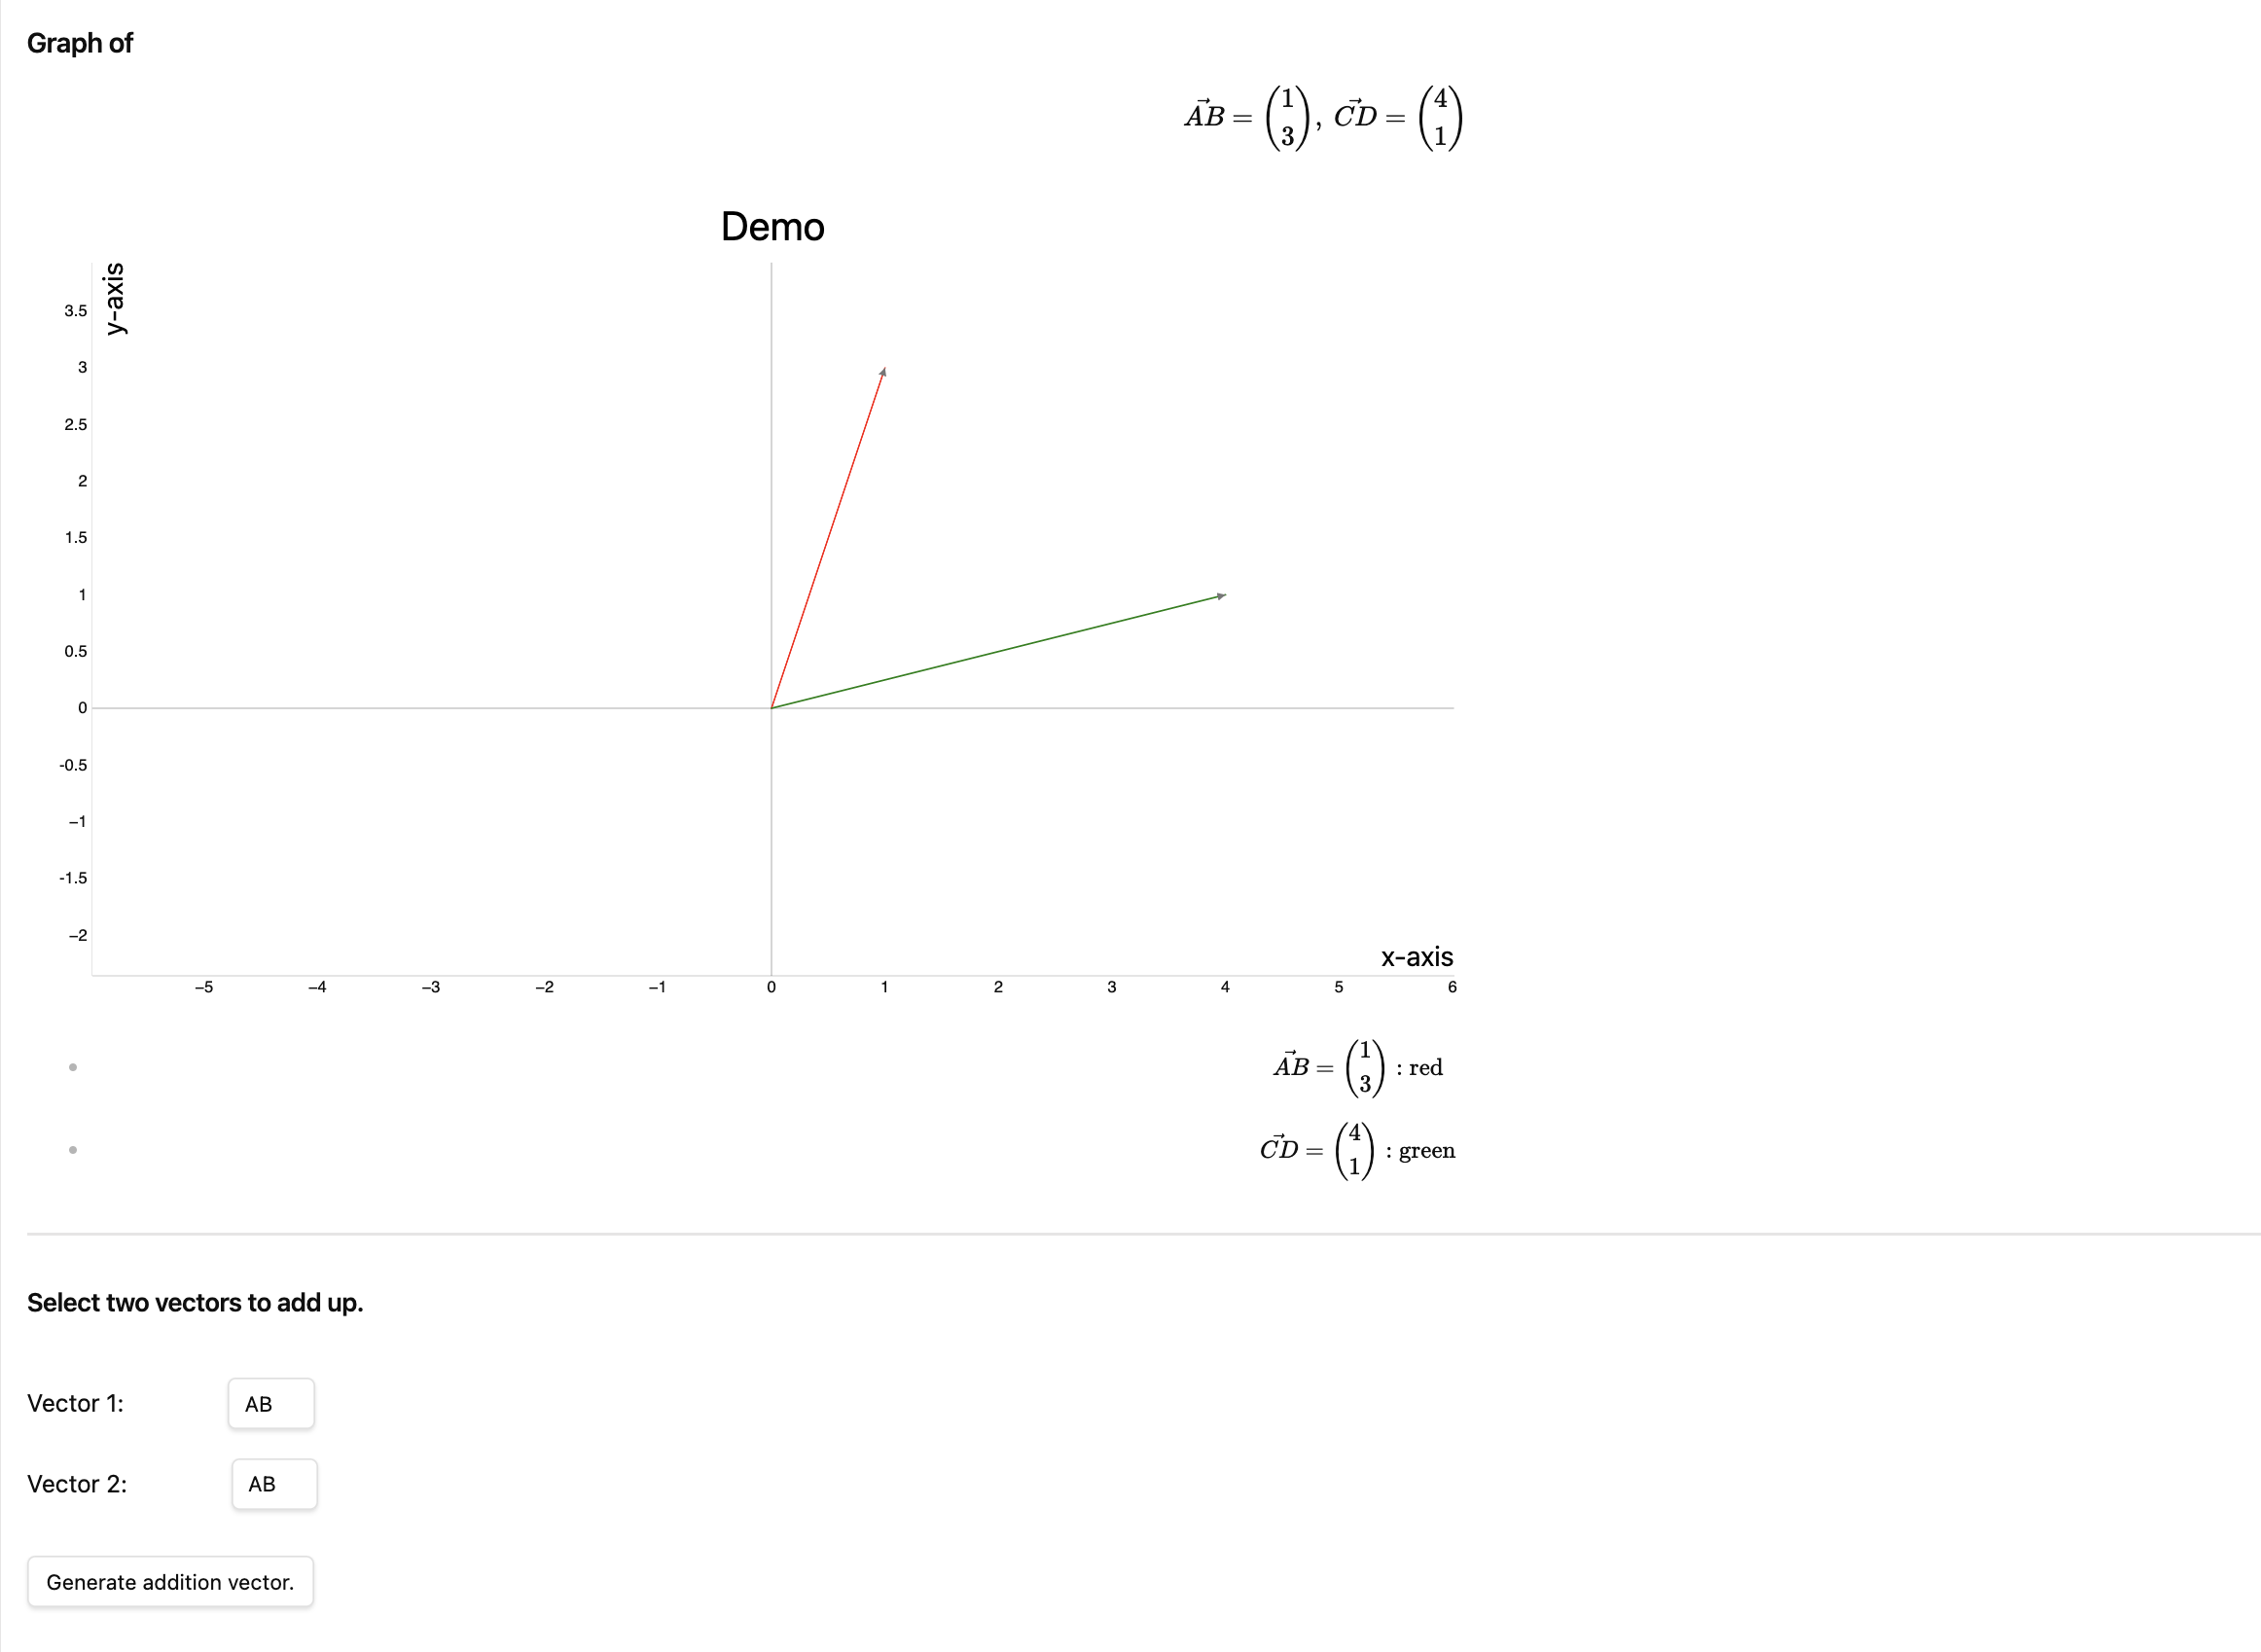
Drawing Vectors
- Select a LaTeX equation of a vector (with or without the $ is fine)
- If you are unsure on how to write vectors in LaTeX, this link may be helpful
- E.g. \vec{AB} = \begin{pmatrix} 1 \ 2 \end{pmatrix}
- Note: There has to be a \vec, \overrightarrow would not work here
- Use the command "Draw Vector" to generate the vector graph
- A new page will be opened with the equation, the graph, a function to add two vectors and generate the resultant vector, and colour coding of the vectors
-
Demo:
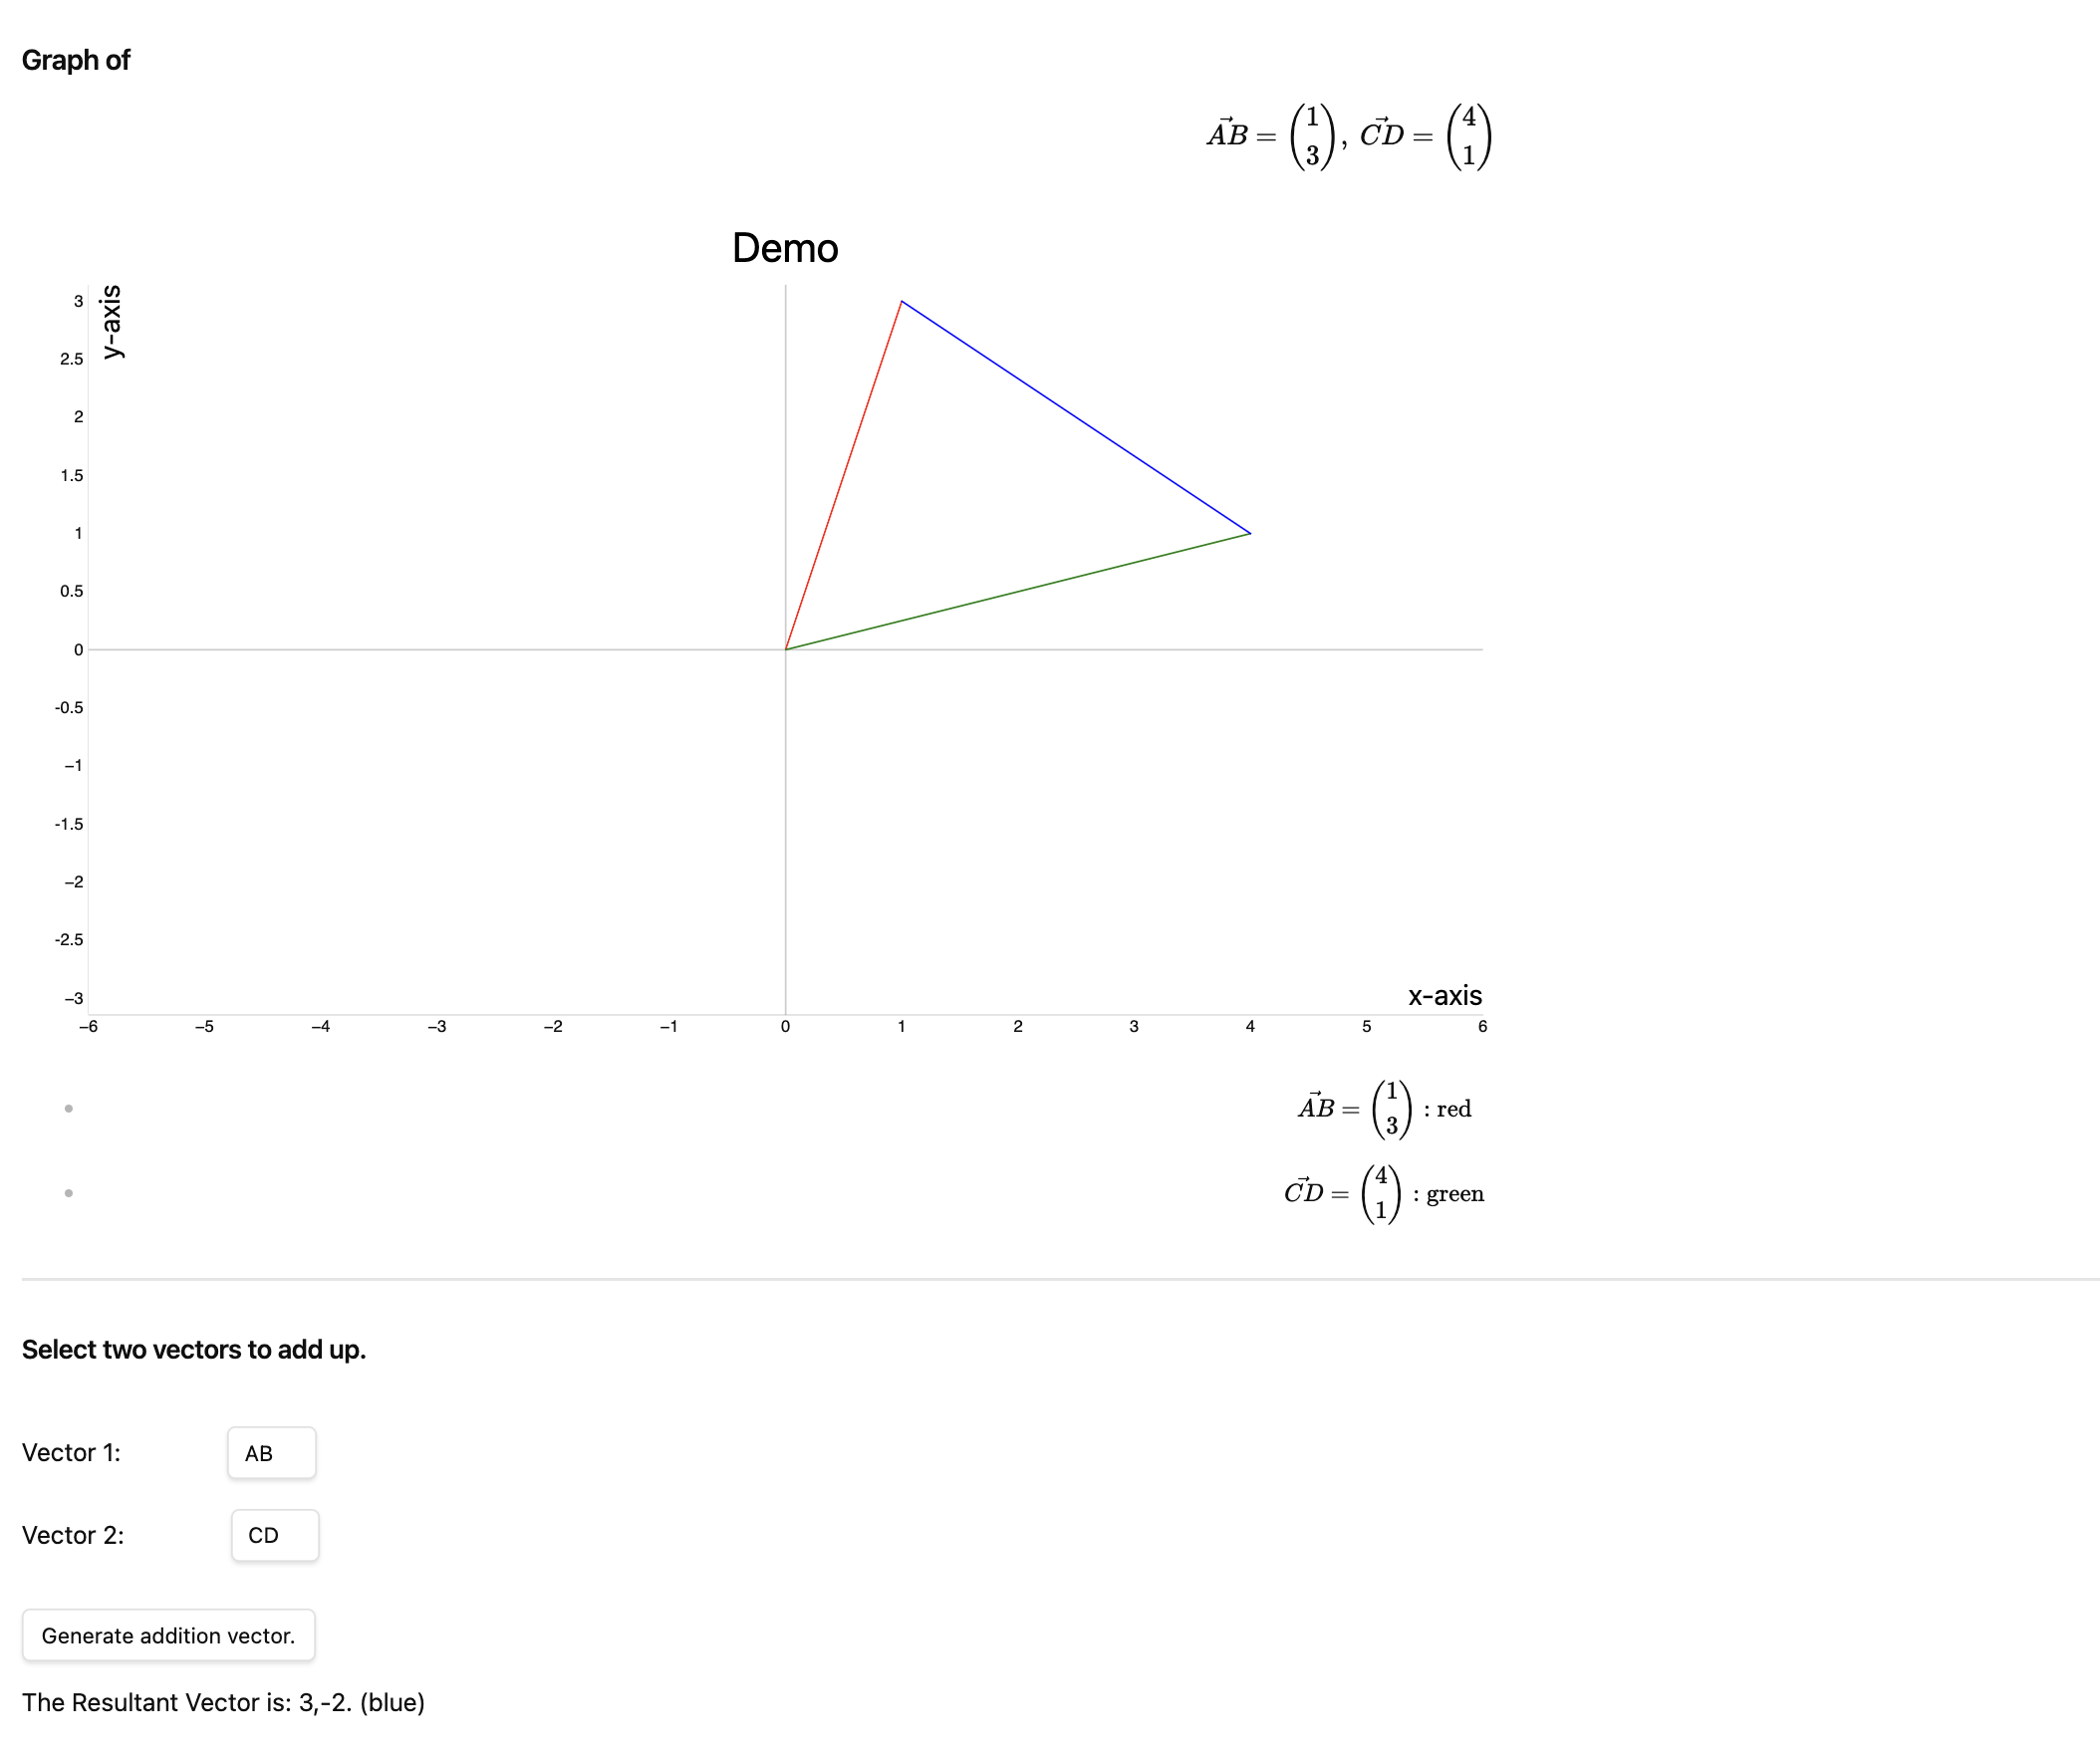
-
Demo of addition vector:
Multiple Graphs/Vectors
- To generate multiple graphs or vectors, add "\newline" in between the functions in the LaTeX equation.
Options
In the settings, you may change the
- x & y axis labels
- title
- width & height
- grid visibility
- ability to zoom
For plugin developers
Search results and similarity scores are powered by semantic analysis of your plugin's README. If your plugin isn't appearing for searches you'd expect, try updating your README to clearly describe your plugin's purpose, features, and use cases.