Graph by Jexyllax
approvedby pierre
Draw graphs and figures in your notes: coordinate grid, function curves, lines, geometric shapes, computed intersection points and tangents, with PNG and PDF export. - This plugin has not been manually reviewed by Obsidian staff.
Graph by Jexyllax
Draw mathematical and economics figures directly inside Obsidian notes: a
coordinate grid, function curves typed from the keyboard, lines, geometric
shapes, computed intersection points and tangents. Graphs are stored as
.graph files that open in their own tab, like a canvas, and can be embedded
in any note.
Everything runs locally: no network request, no external dependency, no build step.
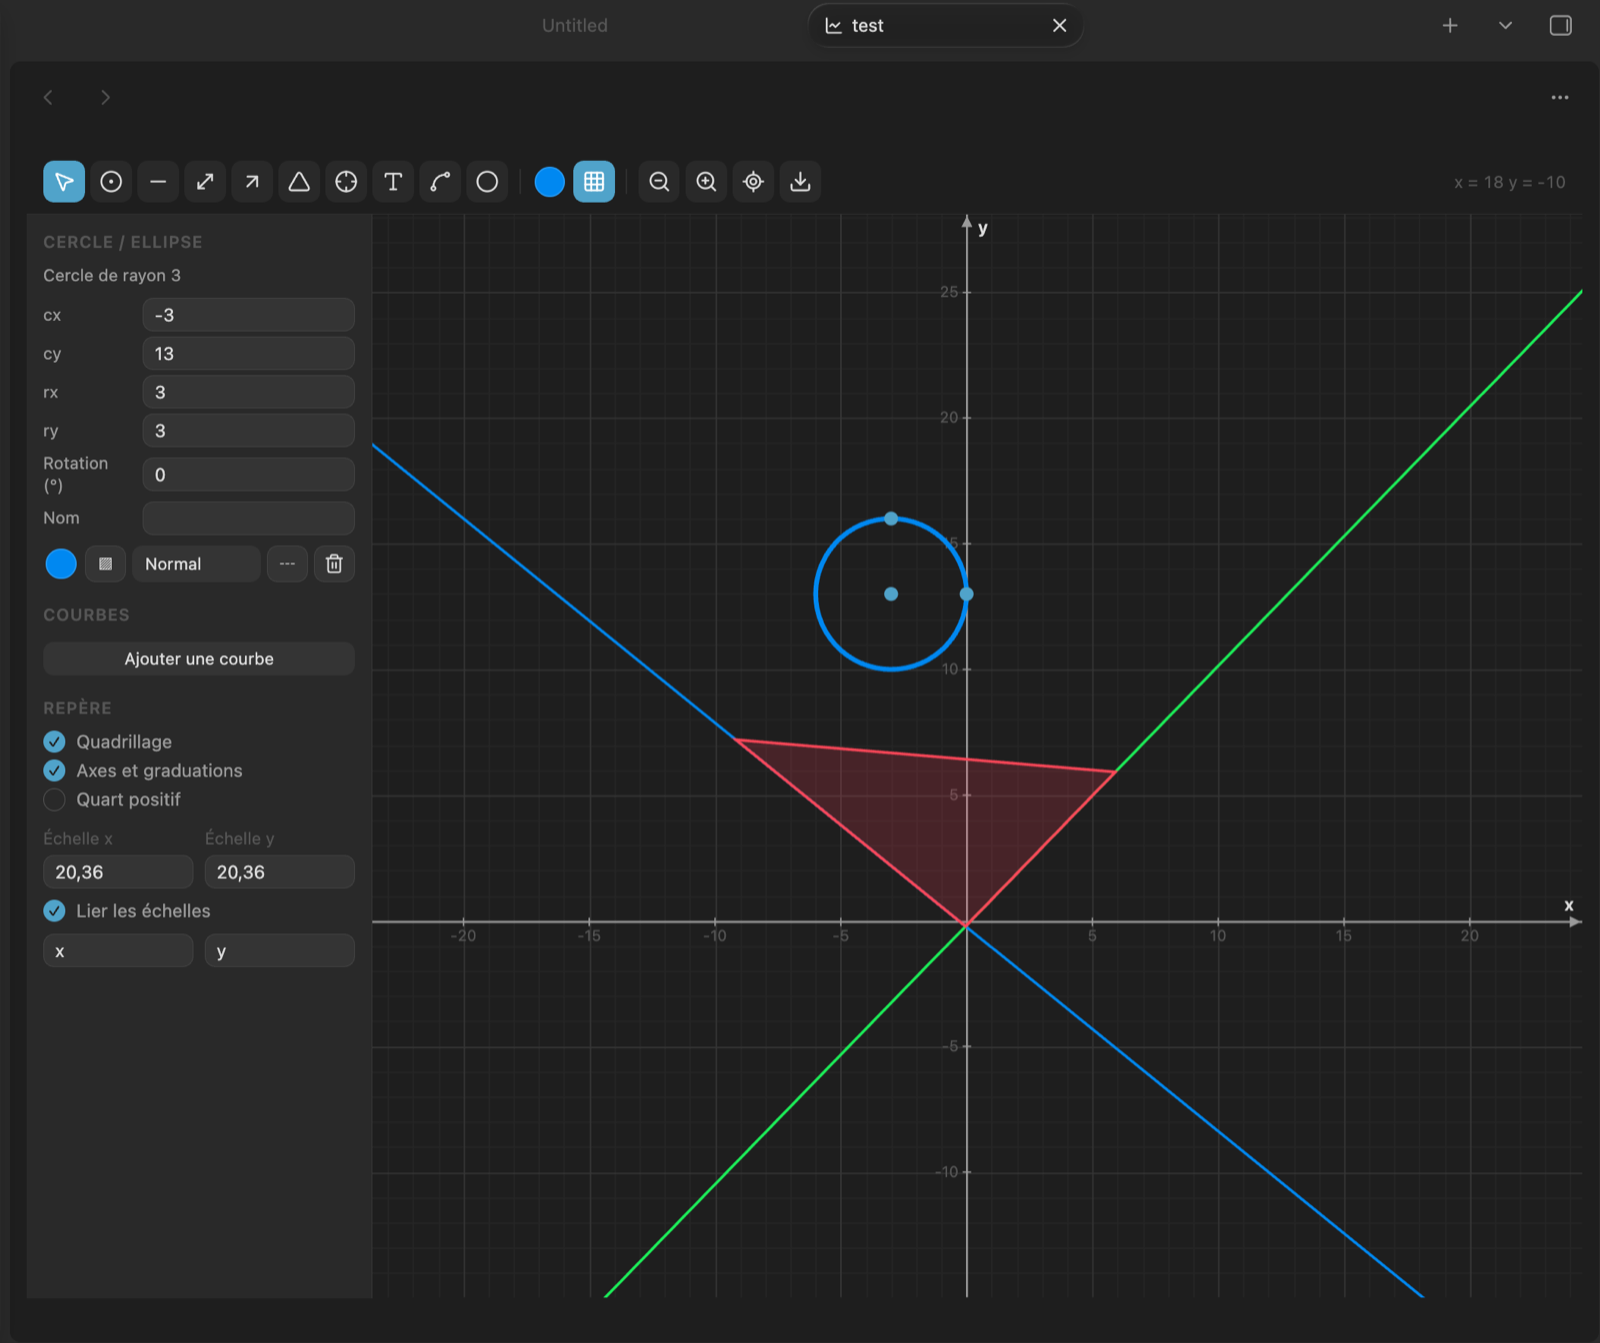
Features
- Coordinate grid with independent X and Y scales, optional first-quadrant view for supply and demand diagrams, and free axis labels.
- Function curves typed in plain notation —
2x,3(x+1),x²,e^x,sin(x)/x,√x,1/x. French decimal commas (0,5x) are accepted. - Drawing tools: point, segment, line, arrow, text, free shape, plus rectangle, square, circle, ellipse, triangles, rhombus, pentagon and hexagon.
- Computed intersection points: click two lines or curves and the exact point is placed, then recalculated whenever a parent moves or its equation changes.
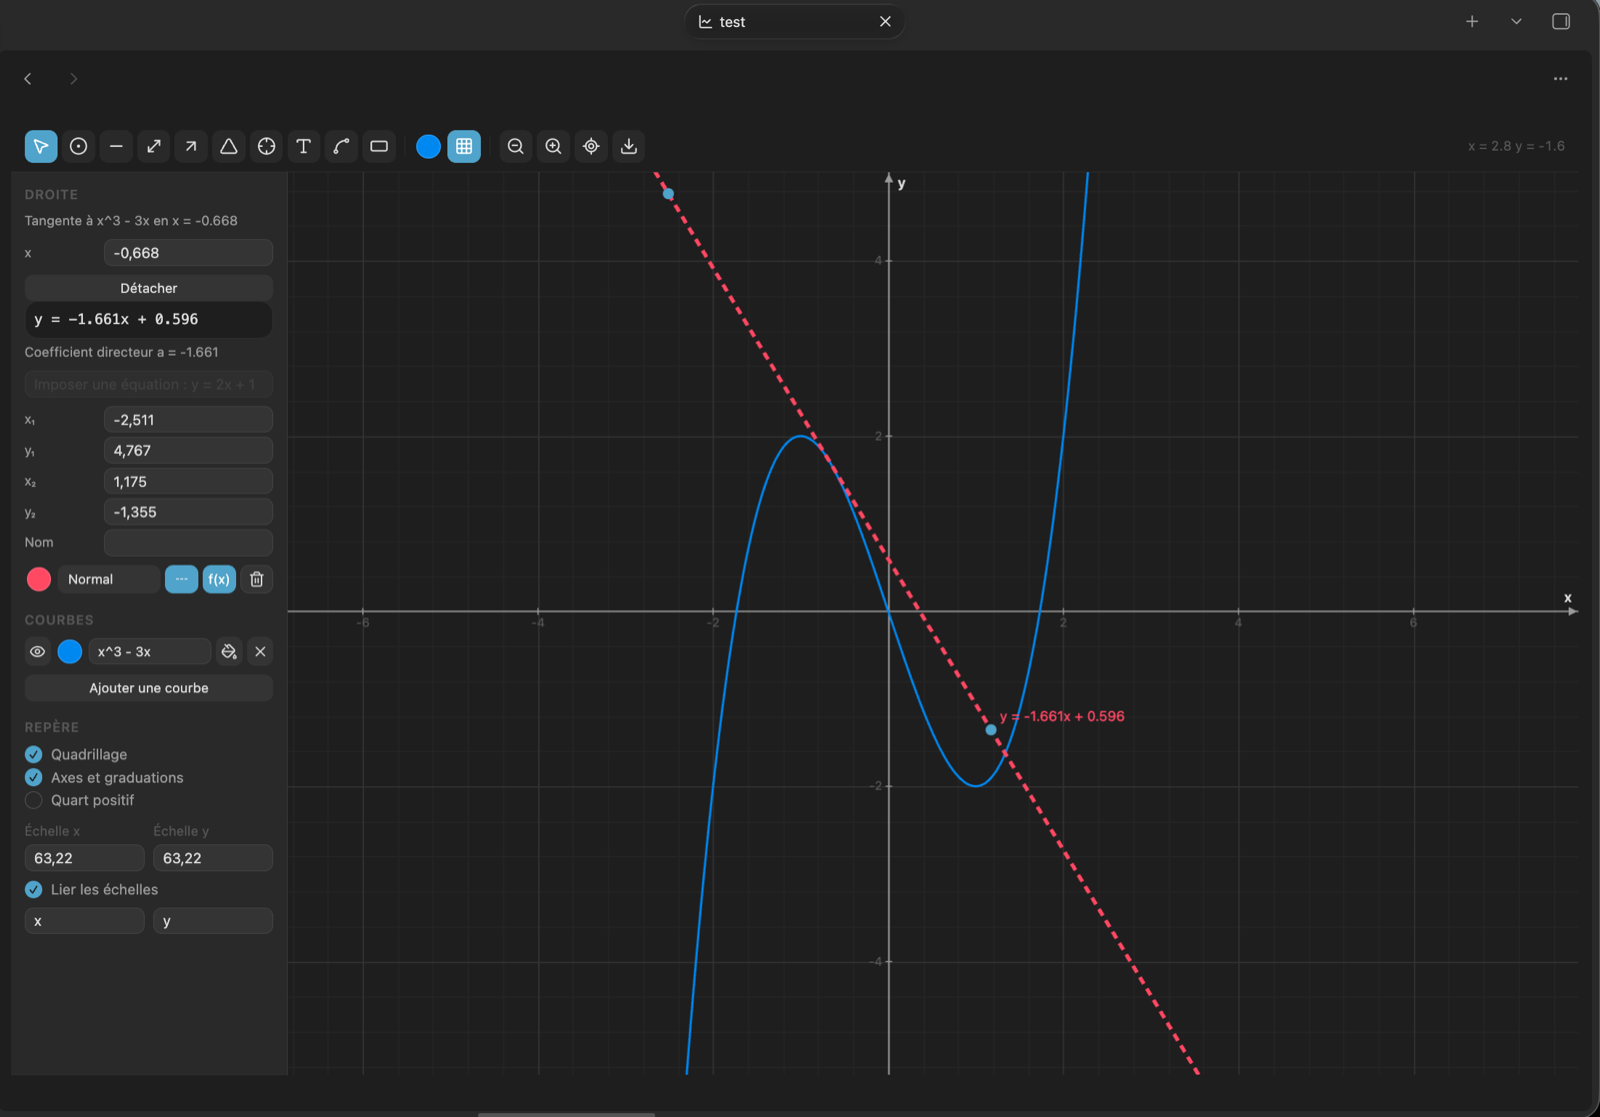
- Tangents: click a curve to draw its tangent, with its equation.
- Snapping to existing points, endpoints, lines and curves — hold
Cmdto place freely. - Attached endpoints: a segment endpoint dropped on a point follows it.
- Shaded areas: under a curve between two bounds, or as free shapes.
- Export to PNG and PDF, or copy the image to the clipboard.
- Note previews:
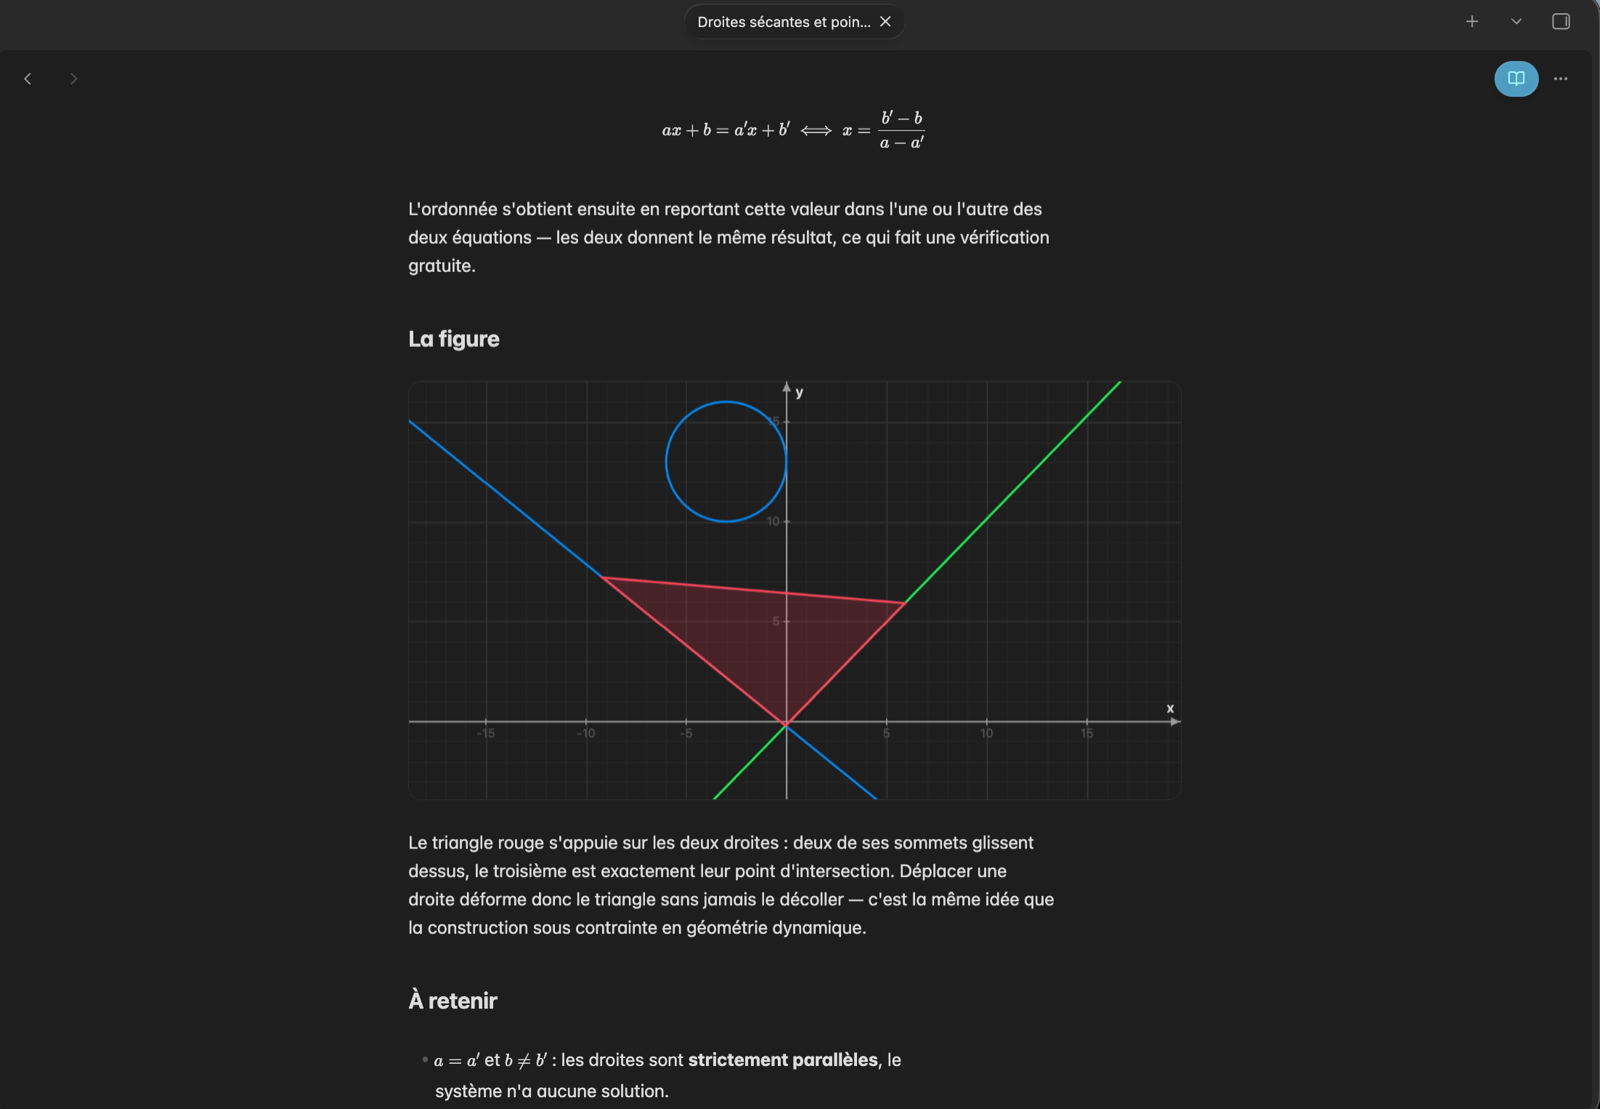
![[my-graph.graph]]renders the graph inside a note and counts as a regular link, so it appears in the graph view and in backlinks. A plain[[my-graph.graph]]alone on its line renders the same way, without the leading exclamation mark, in both reading mode and Live Preview. HoldCmd(Ctrlon Windows) over a preview to pan and zoom it without opening the file; the framing stays local to that preview. - Bilingual interface: English and French.
Tangents and curves
Type a function in the side panel, then click the curve with the tangent tool. The tangent carries its equation and is recomputed whenever the expression or the abscissa changes.
Graphs inside notes
A link to a graph, alone on its line, renders the figure in place — in reading mode and while editing.
Usage
Click the ribbon icon Create graph, use the command palette, or right-click a
folder and choose New graph. A .graph file is created and opens in its own
tab.
To place a graph in a note, run Insert a graph into the note from the command palette, or copy the embed link from the export menu.
Shortcuts
| Action | Shortcut |
|---|---|
| Pan / zoom | drag the background / scroll |
| Horizontal or vertical zoom only | Shift / Alt + scroll |
| Constrain to horizontal, vertical or 45° | Shift while drawing |
| Perfect square or circle | Shift while drawing a shape |
| Free placement, no snapping | Cmd while drawing |
| Rename an object | double-click |
| Nudge, duplicate, delete, undo | arrows, Cmd+D, Del, Cmd+Z |
Settings
Language, help text, cursor coordinates, contextual messages, panel width, default snapping, default colour and thickness, defaults applied to new graphs, and note preview height.
File format
.graph files are readable JSON: view position and scales, style options, the
list of functions, and the list of objects. Files written by earlier versions
are migrated on open.
Development
No build step: main.js is plain JavaScript loaded directly by Obsidian.
The test suite runs outside Obsidian, in JavaScriptCore, with stubs for the Obsidian API:
sh tests/run.sh
It covers the expression parser and accepted notations, line equations, intersections, numeric root finding, polygons and geometric shapes, separate scales, snapping, attached endpoints, tangents, rotation, file migration, the translation tables, and the structure of the generated PDF.
Licence
MIT.
For plugin developers
Search results and similarity scores are powered by semantic analysis of your plugin's README. If your plugin isn't appearing for searches you'd expect, try updating your README to clearly describe your plugin's purpose, features, and use cases.