Vault Full Statistics
approvedby jtprogru
Status bar item with vault full statistics such as number of notes, files, attachments, links, tags and quality of vault.
Vault Full Statistics Plugin






NOTE: This plugin is a modified fork of the Obsidian Vault Statistics Plugin.
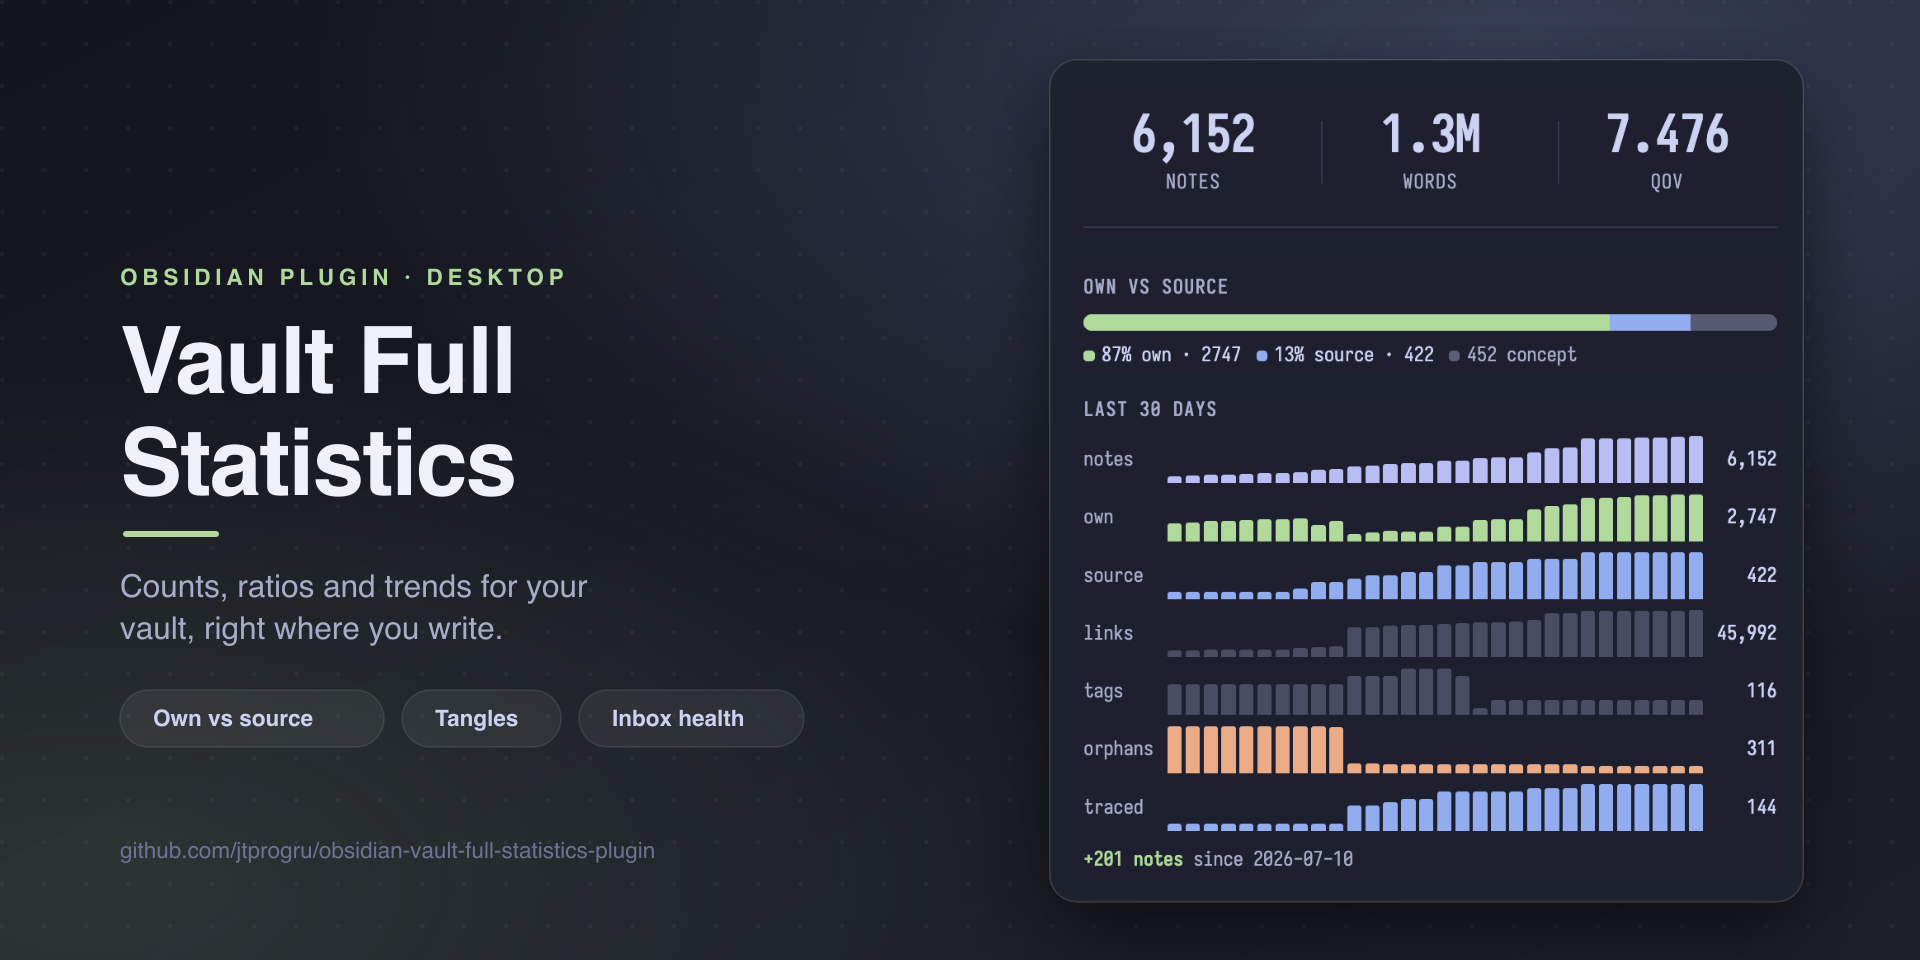
Quantify the shape of your knowledge base: counts, ratios, and trends right inside Obsidian. A click-to-cycle status bar item gives you the headline numbers; a dedicated side view goes deep — own vs source split, dangling sources, tangles, inbox health, taxonomy drift, and a 30-day sparkline.
Requires: Obsidian 1.13.1+ on desktop. Mobile is not supported.
Languages: English and Russian. English is the default; Russian and follow-Obsidian are opt-in under Settings → Language.
Features
Status bar
- Notes, links, tags, QoV (Quality of Vault = links ÷ notes)
- Own / source counts and percentages
- Concepts and orphans (no incoming links)
- Trace percentage (share of source notes referenced by at least one own note)
- Click to cycle, hover to see everything at once
- CSS snippets to show several stats simultaneously (see Advanced Usage)
Side view (Open vault statistics command)
- Hero panel — notes, total words, QoV in big readable type
- Own vs source ratio bar — your thinking vs external material, with concepts as a grey zone
- Metrics grid — links, tags, concepts, orphans, average words per note (each toggleable)
- Sources with trace — how many source notes are linked from your own notes; surfaces dangling sources as clickable pills
- Inbox health — notes in inbox folders or tagged for review, bucketed by age (<1d / 1–7d / 7–30d / 30+d)
- Folder breakdown — PARA-style groups with own/source split per group
- Tag taxonomy drift — rare tags (likely typos) and tags outside your canonical set
- 30-day history sparkline — daily snapshots of notes, own, source, links, tags, orphans, traced
Tangles
A "tangle" is a note that bridges large parts of your graph — many incoming links, many outgoing links, or both. The plugin can:
- List tangles in a dedicated
Open vault tanglesside view, sorted by selected mode (AND / OR / SUM thresholds) - Generate a Markdown report note via
Create tangles report note, dropped into a configurable folder
CSV export
Export statistics history to CSV opens the native OS save dialog (with an in-vault folder picker fallback) and writes the full history snapshot stream as CSV — for use in spreadsheets, Jupyter, or anything else.
Installation
Recommended — Obsidian Community Plugins: the plugin is published in the official Obsidian community plugin catalog. Open Settings → Community plugins → Browse, search for Vault Full Statistics, click Install, then Enable. Updates are delivered through Obsidian itself.
For pre-releases (testing unreleased features), use BRAT: add jtprogru/obsidian-vault-full-statistics-plugin and enable it.
Manual install: grab the latest main.js, manifest.json, and styles.css from the release section and drop them into <vault>/.obsidian/plugins/vault-full-statistics/.
This plugin is desktop-only and requires Obsidian 1.13.1 or newer. Earlier builds lack the declarative settings API the settings tab is built on, and the state summaries on its navigable entries; if you are on an older Obsidian, it will keep offering you 1.20.2, which works.
Usage
After enabling, the status bar shows a count. Click to cycle through statistics; hover to see all of them in a tooltip. Toggle which statistics are visible in the plugin settings.
Open the side view via Open vault statistics (command palette or ribbon icon). Sections beyond the hero are opt-in — enable Folder breakdown, Sources-with-trace, Inbox health, Tag taxonomy drift, and History in settings to surface them.
For own/source classification, configure your own/source/concept tags in settings (defaults: thought, book, concept, etc.). Any note carrying one of those tags is counted accordingly. Each of the three also has a matching folders list, for vaults that sort notes by location instead of tagging each one.
Settings reference
All settings live under Settings → Community plugins → Vault Full Statistics, and are searchable from the settings search box. Defaults are sensible — most users only touch own/source tags and the opt-in section toggles.
The tab itself is an index. The first screen holds one toggle and a list of navigable entries grouped under What gets counted, Side view and Tools; everything below lives one level down on its own page. Each entry shows its current state (11 of 12, 3 groups, AND ≥ 5/5, Off) and carries a warning marker when the section is enabled but configured to render nothing. If you know what you are looking for, Settings → Search finds the row directly and opens the page it lives on.
Editable lists — excluded folders, the tag sets, folder groups, inbox folders — are named by the header sitting directly above them, next to the + that adds an entry. What belongs in a list is spelled out inside it while it is still empty. Every list supports drag-to-reorder and removal with Delete or Backspace.
Language
- Language —
English(default),Русский, orAuto (follow Obsidian). The plugin stays English until you change this: updating it never switches the interface of somebody who did not ask for it. PickAutoif you want it to follow Obsidian's own interface language from now on. - Switching redraws the settings tab, both side panels and the status bar right away. Command names and the ribbon tooltip only change after the plugin reloads — Obsidian caches those when they are registered, and a notice reminds you.
- Keep hero labels in English — appears only when the interface is not English. The three top tiles keep
notes/words/QoVand the12.35Knumber format, which fit a narrow sidebar better than «заметок» / «слов» and «12,35 тыс.». Tooltips stay translated. - Numbers follow the language too:
1,234in English,1 234in Russian. UnderAutothe grouping follows Obsidian even for languages the plugin has no translation for — a German interface gets English text and German digit grouping. - Not translated by design: the CSV export file name and the CSV column headers (it is an interchange format — your spreadsheet formulas keep working), and the default tag values (
thought,book,concept, …), which are vault content rather than interface.
Status bar
- Show individual items — when on, every enabled statistic is rendered as its own status bar slot; when off (default) the bar shows one statistic at a time and clicking cycles.
- Status bar items — page with a toggle per statistic: Show notes / words / links / tags / quality / own / source / own % / source % / concepts / orphans / trace %. These apply in both modes; cycling walks only the enabled ones and skips the rest. All on by default except concepts.
What gets counted
- Excluded folders — folders to skip entirely (templates, archives, plugin data). Added through the vault folder picker; matched as path prefix with a
/boundary. - Note classification — the three tag sets and their matching folder lists behind own/source and the hero panel. A side counts as configured when it has a tag or a folder; the entry warns only when own or source has neither, because the ratio is meaningless then.
- Own tags (default:
thought,synthesis,fleeting) — mark notes as your own thinking. - Own folders (default: none) — folders whose notes count as your own thinking whether or not they carry an own tag.
- Source tags (default:
book,article,video,lecture,literature,literature-note) — mark notes about external material. - Source folders (default: none) — folders whose notes count as external material whether or not they carry a source tag.
- Concept tags (default:
concept) — the grey zone between own and source. - Concept folders (default: none) — folders whose notes count as concepts whether or not they carry a concept tag, for vaults that sort concepts by location instead of tagging each one.
- Own tags (default:
Metrics (side view)
Toggle which secondary metrics appear in the side view's grid below the hero panel:
- Links, Tags, Concepts, Orphans, Avg words — all on by default.
Folder breakdown (PARA)
- Show folder breakdown (default: off) — opt-in section that breaks down notes per folder group.
- Folder groups — one row per group,
name = path1, path2. Multiple paths per group are merged; overlap allowed.
Sources with trace
- Show sources-with-trace (default: off) — opt-in section showing how many source notes are referenced by at least one own note.
- Show dangling notes list (default: on) — top 5 untraced source notes inside the section.
Tag taxonomy drift
- Show taxonomy drift (default: off) — opt-in section listing rare tags and tags outside your canonical set.
- Rare tag threshold (default: 3) — tags used fewer than this many times are flagged. Must be a whole number of 1 or more.
- Canonical tags — your accepted tag set. Anything else is flagged as unknown; a canonical parent (e.g.
journal) covers descendants (journal/daily).
Inbox health
- Show inbox health (default: off) — opt-in section bucketing inbox notes by age.
- Inbox folders — folders treated as inbox. Added through the vault folder picker.
- Inbox review tags (default:
inbox/review) — tags marking notes that need processing outside inbox folders.
History
- Show history (default: off) — opt-in 30-day sparkline. Snapshots are recorded daily regardless of this toggle.
- History export folder — last folder used for CSV export, with folder autocomplete. The export command updates this on use.
Tangles
- Selection mode (default: AND) —
AND(both directions must meet threshold),OR(either direction),SUM(in + out must meet a single threshold). - Min incoming links / Min outgoing links (default: 5 each) — thresholds for AND/OR modes.
- Min in + out (default: 10) — threshold for SUM mode.
- Top N (default: 25) — limit how many tangles to show in the view and report.
0means no limit. - Tangles report folder — where
Create tangles report notesaves its output, with folder autocomplete. Empty = vault root. - Tangles exclude — notes (full path) or folder prefixes to skip in tangle detection. The
+button picks a note, the folder button next to it picks a folder. Folder match requires a trailing slash boundary.
FAQ / Troubleshooting
What is QoV? Quality of Vault = total links ÷ total notes. A measure of how interconnected your vault is. There's no objective "good" value; track the trend instead.
Why does the notes count differ from Obsidian's File pane?
The plugin counts Markdown notes only and skips Excalidraw drawings and Kanban boards (they're file containers, not text). It also skips excluded folders configured in settings. If a number still looks off, check whether your vault contains .excalidraw.md files or notes with excalidraw-plugin / kanban-plugin in frontmatter.
The side view is empty / shows "no notes classified yet" — why?
The own/source ratio needs notes tagged with own or source tags. Out of the box the defaults are sensible (#thought, #book, #article, ...), but if you use different tag names, configure them in settings. The hero panel and metrics grid render regardless.
When are history snapshots taken? Once per local day, debounced by 10 seconds after the last metric update. The very first snapshot appears once your vault metrics settle on first load. A second day is required before the sparkline can render a trend.
How do I set up own/source classification for my own taxonomy?
- Decide on tag names that represent your own thinking versus external material.
- Add them to Own tags / Source tags in settings (the leading
#is optional). - The collector restarts and reclassifies on save — no Obsidian restart needed.
What's a "tangle"? A note that bridges large parts of your graph — high incoming-link count, high outgoing-link count, or both. Useful for finding MOCs (maps of content), index notes, and accidentally over-connected hubs. Detection mode (AND/OR/SUM) and thresholds are configurable.
Does this work on mobile?
No. isDesktopOnly is set in the manifest. The metric pipeline (vault scan + memoization) is tuned for desktop and uses APIs not available on iOS.
How do I exclude a specific note or folder from statistics?
- From counts entirely — add the folder to Excluded folders.
- From tangle detection only — use the Tangles exclude list (note path or folder prefix).
My CSV export saves to vault instead of disk. Native save dialog (File System Access API) is preferred when available; the plugin falls back to an in-vault folder picker on environments without it. Use a recent Obsidian + Electron build to get the OS dialog.
Privacy
This plugin is designed to be self-contained and respectful of your vault.
- No network access. No telemetry, no analytics, no external requests. The plugin makes zero HTTP/HTTPS calls — everything runs locally against your vault.
- No note mutation. Your notes and their frontmatter are never modified. Reads go through
vault.cachedRead; the only writes are to files you explicitly produce via commands:Export statistics history to CSV(writes the CSV you choose to save) andCreate tangles report note(writes a Markdown report to your configured folder). - Local persistence only. Settings and the 30-day history snapshot stream are stored via Obsidian's standard plugin data API, inside your vault.
- Desktop-only.
isDesktopOnly: true— the plugin does not run on iOS/Android.
If you ever see this plugin attempting network access or modifying notes you didn't ask it to, that is a bug — please open an issue.
Advanced Usage
Showing All Statistics
All statistics can be shown by creating and enabling a CSS snippet with the following content.
/* Show all vault statistics. */
.obsidian-vault-full-statistics--item {
    display: initial !important;
}
Showing Selected Statistics
Similarly, one can show certain statistics. Below is a snippet that hides all but the notes statistic. The snippet can be modified to include more or different statistics.
/* Hide all statistics. */
.obsidian-vault-full-statistics--item {
    display: none !important;
}

/* Always show the notes statistic. */
.obsidian-vault-full-statistics--item-notes {
    display: initial !important;
}
Development
Requires Node.js 18+ and npm.
git clone https://github.com/jtprogru/obsidian-vault-full-statistics-plugin
cd obsidian-vault-full-statistics-plugin
make install     # npm install
make dev         # watch-mode esbuild — rebuilds main.js on save
make test        # jest test suite
make lint        # oxlint
make build       # production build (tsc type-check + esbuild)
make check       # everything CI runs: lockfile install, lint, test, build
make (or make help) lists every target. Besides the ones above there are ci-install, typecheck, test-watch, coverage, lint-fix, clean, deploy, version and tag. Most are thin wrappers over the matching npm run script, so plain npm works just as well.
For iterating against a live vault, either symlink the repo into <vault>/.obsidian/plugins/vault-full-statistics/, or build and copy the artifacts there:
make deploy VAULT=/path/to/vault
Either way, toggle the plugin off and on in Obsidian after each rebuild.
Source code lives in src/. Notable modules:
main.ts— plugin entry point, status bar, commandsstatisticsView.ts— side view rendering (hero, sections)collect.ts— vault metrics collector and memoized graph derivativestangles.ts/tanglesView.ts— high-degree note detection and reporthistoryStore.ts— daily snapshots and CSV exportsettings.ts— settings tab
Changelog
See CHANGELOG.md for notable changes per release, or the full list at GitHub Releases.
License
For plugin developers
Search results and similarity scores are powered by semantic analysis of your plugin's README. If your plugin isn't appearing for searches you'd expect, try updating your README to clearly describe your plugin's purpose, features, and use cases.