ChartSpark
approvedby pooyash1998
This plugin has not been manually reviewed by Obsidian staff. Instantly turn tables, checkboxes, and key:value data into interactive charts.
ChartSpark
Turn your Obsidian notes into interactive charts in seconds. Place your cursor inside any table, checkbox list, or key:value block — press a shortcut — and a live, auto-refreshing chart is inserted directly into your note.
Screenshots
| Monthly revenue (Pie) | Sprint progress (Doughnut) |
|---|---|
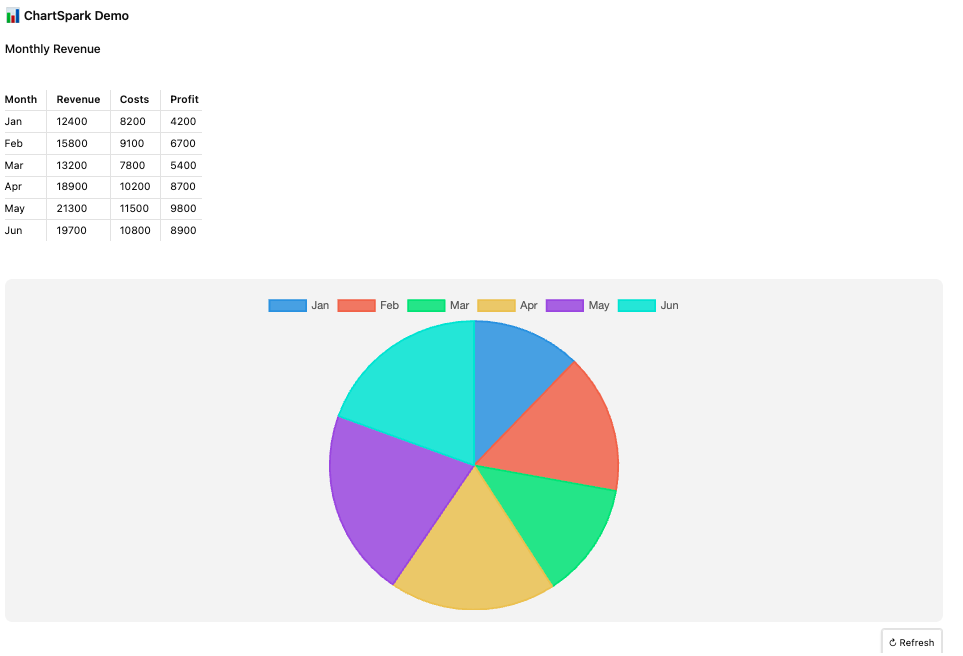 | 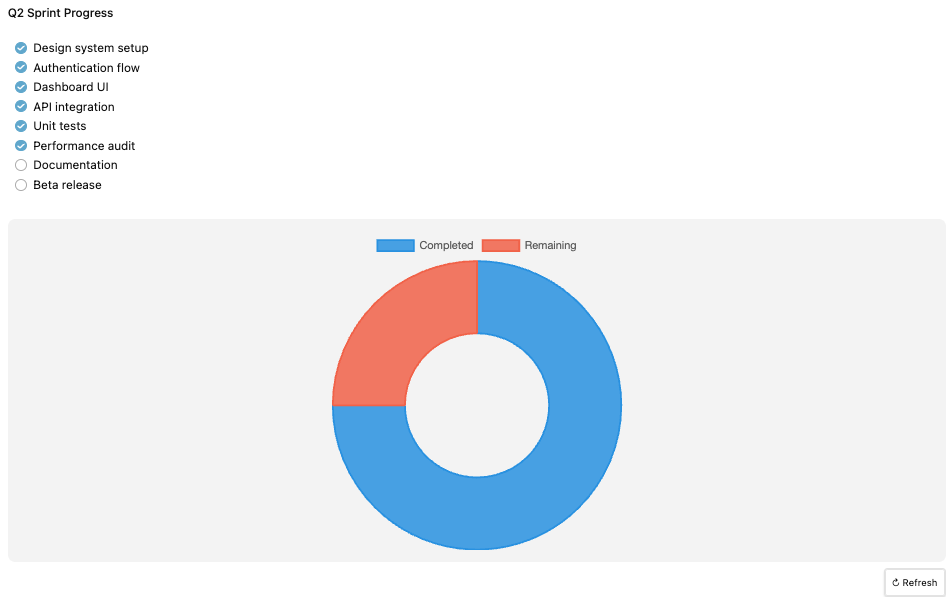 |
| Product mix (Polar Area) | Team availability (Bar) |
|---|---|
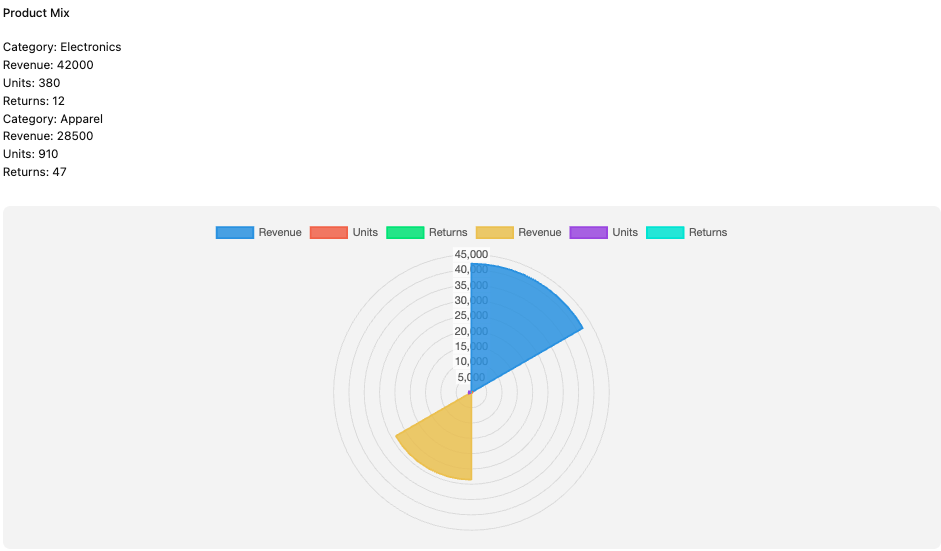 | 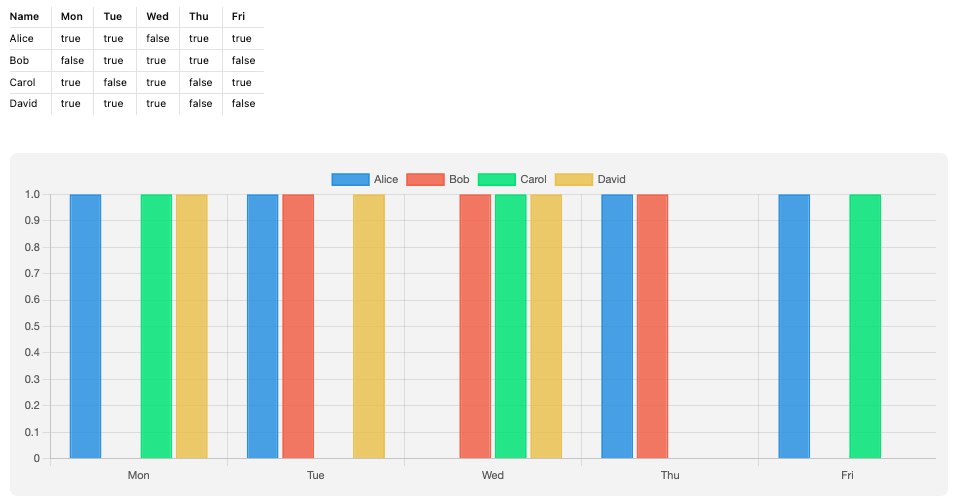 |
Features
- Six chart types — Bar, Line, Pie, Doughnut, Radar, Polar Area
- Smart table support — column picker lets you choose which column is the category axis and which columns are the value series
- Axis swap — transpose the data matrix with one click (rows ↔ columns)
- Horizontal bar — toggle any bar chart to horizontal orientation
- Multi-block picker — when a note has multiple data blocks, a picker shows previews of each so you select exactly what to chart
- Live auto-refresh — charts update in real time as you edit the source data; each chart tracks its own source block by ID, so multiple charts in the same note refresh independently
- Versatile parsing — handles booleans (
true/false), currency ($1,200), percentages (42%), yes/no, and mixed tables; strips trailing empty columns automatically - Delete button — hover any chart to reveal a × button that removes the block in one click
- Vault scan — aggregate checkbox data across your entire vault or a folder into a single chart
- PNG export — download any chart as an image
- Theme-aware — adapts to Obsidian's light and dark themes via CSS variables
Supported input formats
| Format | Example |
|---|---|
| Markdown table | | Item | Sales | |
| Checkbox list | - [x] Write tests |
| JSON object | {"Revenue": 500, "Cost": 300} |
| JSON array | [{"name": "A", "count": 5}] |
| Key : value | Revenue: 500 |
Tables can contain numbers, booleans (true/false, yes/no), currency, or percentages — any column whose values can be converted to a number is offered as a value series.
Usage
Generating a chart
- Press
Cmd/Ctrl + Shift + C(or right-click anywhere in the editor → Generate chart from this note) - If the note has multiple data blocks, a picker appears — click the one you want
- For tables, choose the label column (category axis) and value columns (series)
- Use ⇄ Swap axes to transpose rows and columns
- Select a chart type from the tabs; use ↔ H-Bar for horizontal bars
- Click Insert chart — a
chartsparkblock is inserted directly below the source data
Auto-refresh
Charts re-render automatically when the source data changes. Each chart stores a unique ID and scans backwards from its own position to find its source block — so editing one table only refreshes the chart that belongs to it.
Manual refresh
Enable Show refresh button in settings to display a ↻ Refresh button on each chart.
Deleting a chart
Hover over any chart and click the × button in the top-left corner.
Manual chart block
Charts are stored as standard fenced code blocks and can be written or edited by hand:
```chartspark
{
  "type": "bar",
  "data": {
    "labels": ["Q1", "Q2", "Q3", "Q4"],
    "datasets": [{"label": "Revenue", "data": [120, 95, 140, 180]}]
  }
}
```
Any valid Chart.js configuration can be placed in the data and options fields.
Commands
| Command | Shortcut | Description |
|---|---|---|
| Quick chart | Cmd/Ctrl + Shift + C | Generate a chart from data in the active note |
| Generate chart (with preview) | — | Same, but opens the full column-picker preview |
| Scan vault and generate chart | — | Aggregate checkbox data across vault |
| Export active chart as PNG | — | Save the focused chart as an image |
| Insert chart template | — | Insert a blank chart block to edit manually |
Settings
| Setting | Default | Description |
|---|---|---|
| Default chart type | Pie | Chart type pre-selected in the preview modal |
| Auto-refresh charts | On | Re-render when source data changes |
| Max chart width | 600 px | Maximum rendered width (200–1200 px) |
| Show refresh button | On | Display a manual ↻ button on each chart |
Installation
From the Obsidian community plugin list
- Open Settings → Community plugins → Browse
- Search for ChartSpark
- Click Install, then Enable
Manual installation
- Download
main.js,manifest.json, andstyles.cssfrom the latest release - Copy them to
<Vault>/.obsidian/plugins/chartspark/ - Reload Obsidian and enable ChartSpark in Settings → Community plugins
Development
npm install
npm run dev      # watch mode with hot reload
npm run build    # production build
npm test         # run unit test suite
License
For plugin developers
Search results and similarity scores are powered by semantic analysis of your plugin's README. If your plugin isn't appearing for searches you'd expect, try updating your README to clearly describe your plugin's purpose, features, and use cases.