Vega Visualizations
approvedby justin-j-k
Create highly-customizable data visualizations like line charts and scatter plots using Vega or Vega-Lite.
Vega Visualizations Plugin
Create highly customizable data visualizations using Vega or Vega-Lite specifications written in JSON format inside of the Obsidian note-taking app. Additional documentation can be found at the Vega website for formatting Vega specifications and Vega-Lite specifications.
To add a chart or plot, create a code block with vega or vega-lite as the language and add the JSON specification.
Examples
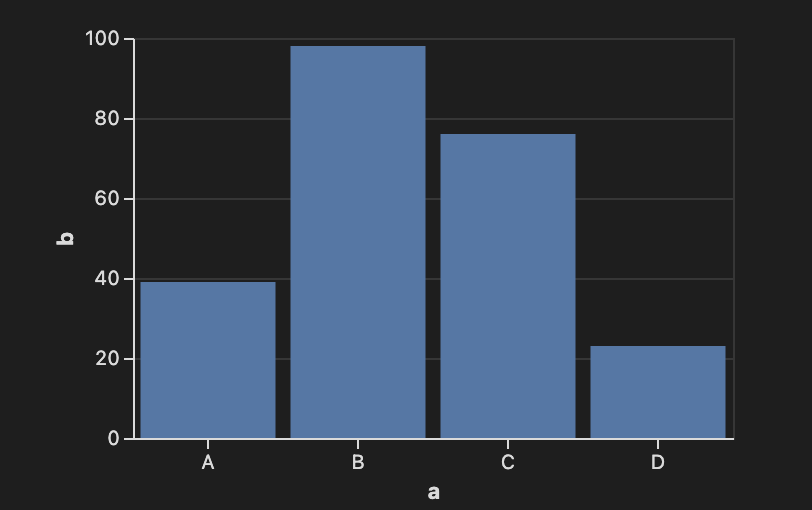
Bar Chart using Vega-Lite
```vega-lite
{
  "width": 300,
  "data": {
    "values": [
      {"a": "A", "b": 39}, {"a": "B", "b": 98},
      {"a": "C", "b": 76}, {"a": "D", "b": 23}
    ]
  },
  "mark": "bar",
  "encoding": {
    "x": { "field": "a", "type": "nominal", "axis": { "labelAngle": 0 } },
    "y": { "field": "b", "type": "quantitative" }
  }
}
```
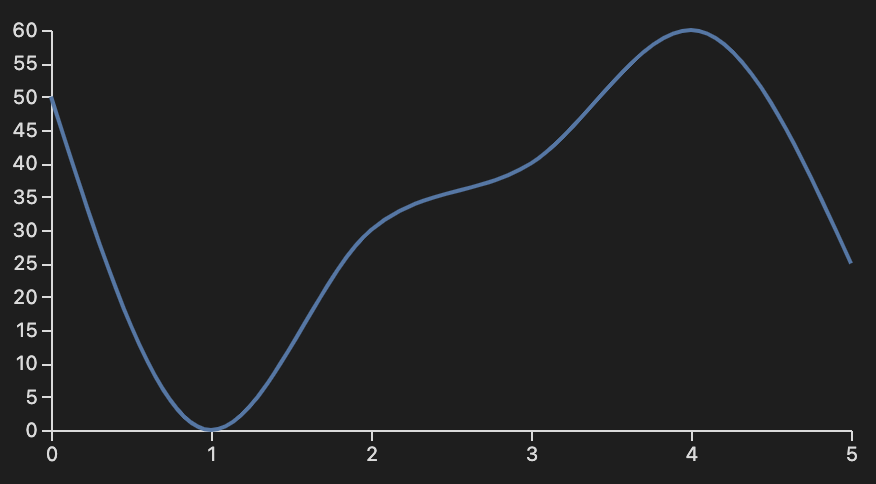
Line Chart Using Vega
```vega
{
  "width": 400,
  "height": 200,
  "data": [
    {
      "name": "table",
      "values": [
        { "x": 0, "y": 50 }, { "x": 1, "y": 0 },
        { "x": 2, "y": 30 }, { "x": 3, "y": 40 },
        { "x": 4, "y": 60 }, { "x": 5, "y": 25 }
      ]
    }
  ],
  "scales": [
    {
      "name": "x",
      "type": "point",
      "range": "width",
      "domain": { "data": "table", "field": "x" }
    },
    {
      "name": "y",
      "type": "linear",
      "range": "height",
      "domain": { "data": "table", "field": "y" }
    }
  ],
  "axes": [
    { "orient": "bottom", "scale": "x" },
    { "orient": "left", "scale": "y" }
  ],
  "marks": [
    {
      "type": "line",
      "from": { "data": "table" },
      "encode": {
        "enter": {
          "x": { "scale": "x", "field": "x" },
          "y": { "scale": "y", "field": "y" },
          "interpolate": { "value": "monotone" }
        }
      }
    }
  ]
}
```
Acknowledgements
Vega, Vega-Lite
BSD 3-Clause "New" or "Revised" License
Copyright (c) 2015-2021, University of Washington Interactive Data Lab
For plugin developers
Search results and similarity scores are powered by semantic analysis of your plugin's README. If your plugin isn't appearing for searches you'd expect, try updating your README to clearly describe your plugin's purpose, features, and use cases.