Tagvis
approvedby Mason Bryant
Visualize your tags as a configurable sunburst visualization.
★ 8 stars↓ 1,362 downloadsUpdated 1y agoMIT
Tag Vis
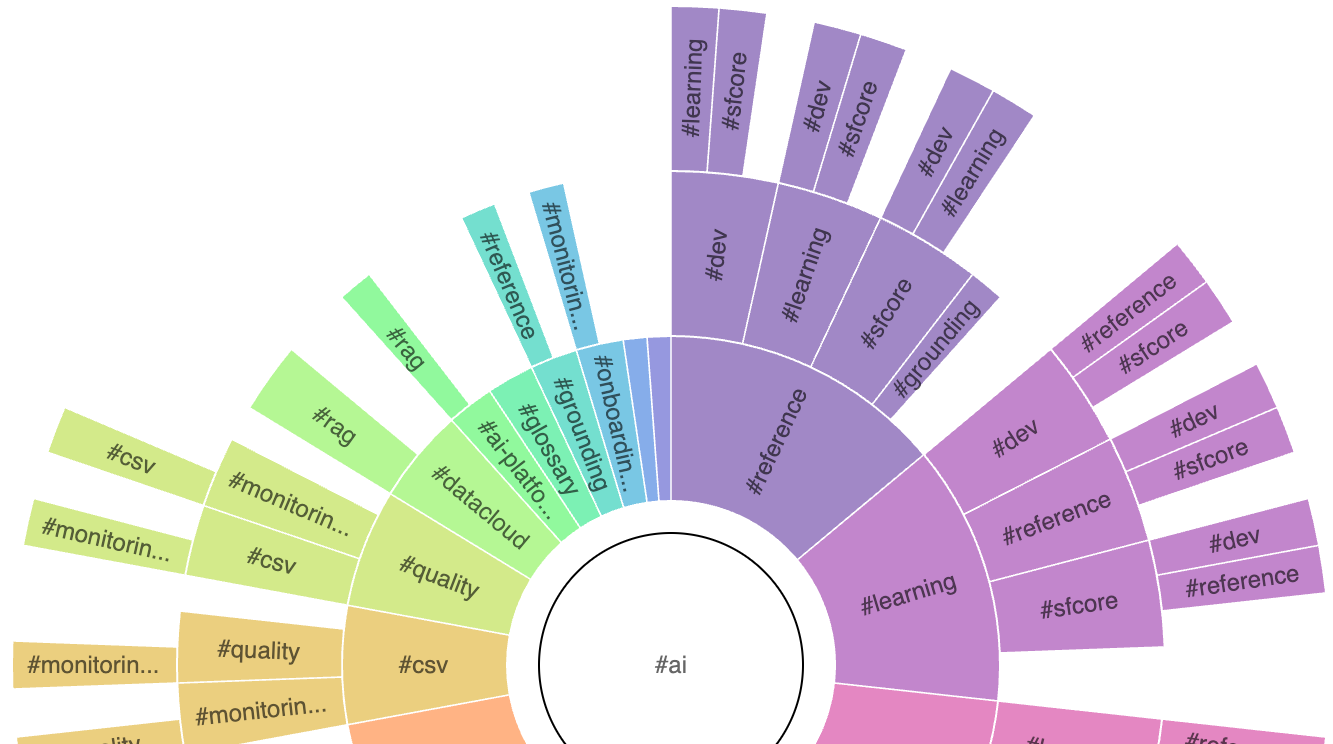
This is a plugin that visualizes the tags in your vault using a sunburst chart. It helps you explore the structure of your tags and their combinations, making it easy to understand how different tags relate to one another.
It is very much a work in progress (including this README) so please stay tuned for updates.
Installation
[!Note]
This plugin requires Dataview
- In Obsidian, open Settings.
- Under Community plugins, select Browse.
- Search for "tagvis" and then select it.
- Select Install.
Prerelease
- Install the BRAT plugin (https://github.com/TfTHacker/obsidian42-brat)
- Click the Add Beta button
- Add this repo (https://github.com/mason-bryant/Obsidian-Tagvis)
Configuration:
Example:
```tagvis
{
	"initialTag": "#ai",
	"maxDepth": 2,
	"ignoreFilesWithTags": ["#foo", "#bar"],
	"filterTags": ["#important"],
	"maxChildren": 15,
	"layout": {
		"width": 800,
		"height": 800
	}
}
```
A single ring of files that are tagged with #work
```tagvis

{
	"initialTag": "#work",
	"maxDepth": 1,
	"ignoreFilesWithTags": ["#archived"],
	"filterTags": [],
	"maxChildren": 25,
	"layout": {
	}
}

```
For plugin developers
Search results and similarity scores are powered by semantic analysis of your plugin's README. If your plugin isn't appearing for searches you'd expect, try updating your README to clearly describe your plugin's purpose, features, and use cases.