Inline Graph
approvedby SVM0N
Render inline force-directed node graphs from gr code blocks. - This plugin has not been manually reviewed by Obsidian staff.
Inline Graph
An Obsidian plugin that renders interactive, force-directed node graphs inline in your notes from a simple gr code block. Like the native graph view, but for arbitrary ideas you define on the spot, not vault links.
- Force-directed physics layout, animated, settles automatically
- Draggable nodes (dragging reheats the simulation)
- Colored, labelled nodes
- Hover a node to expand it and show a tooltip with its text
- Follows your Obsidian theme (light/dark) via CSS variables
- Zero dependencies, no build step, works on mobile
Usage
Add a fenced code block with the language gr:
```gr
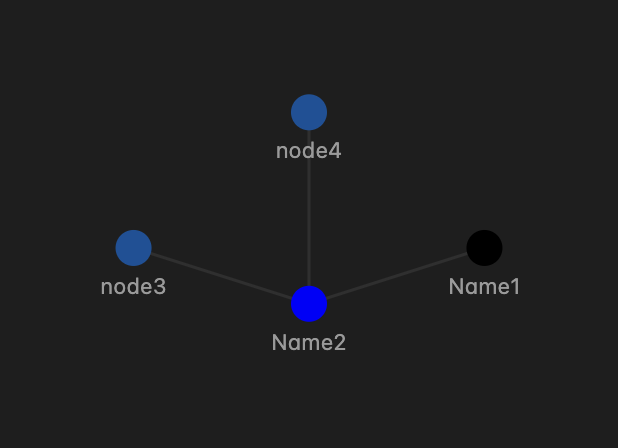
node1-node2; node2-node3; node2-node4: [
node1:{name="Name1",color="black",text="hello world"};
node2:{name="Name2",color="blue",text="hello world2"}
]
```
Syntax
<edges> : [ <node metadata> ]
Edges are pairs of node ids joined by - (undirected) or -> (directed, rendered with an arrowhead), separated by ; (newlines are fine too):
a-b; b->c; a-c
Height of the graph defaults to 320px. Override it per block with a directive on the first line:
height=480
a-b; b-c
Node metadata is optional, lives inside [ ... ], one entry per node:
id:{name="Label", color="blue", text="tooltip text"}
| Property | Meaning | Default |
|---|---|---|
name | Label shown under the node | the node id |
color | Any CSS color (#f50, blue, var(--color-red)) | theme accent color |
text | Tooltip shown on hover | none (no tooltip) |
All parts are forgiving: the trailing : is optional, metadata is optional, and nodes that only appear in edges get sensible defaults. A minimal block like ```gr a-b; b-c ``` works.
Node ids may contain letters, digits, and underscores.
Screenshots
The block above, as source and as the rendered, draggable graph:

Install
Manual (current method)
- Download
manifest.json,main.js, andstyles.cssfrom this repo (either clone it, or download all three files from the latest release). - Create a folder named
inline-graphinside your vault's plugin directory and place all three files there, so you end up with:YourVault/.obsidian/plugins/inline-graph/manifest.json YourVault/.obsidian/plugins/inline-graph/main.js YourVault/.obsidian/plugins/inline-graph/styles.css - In Obsidian: Settings → Community plugins, turn off Restricted mode if needed, hit the reload icon, and enable Inline Graph.
Via BRAT
- Install the BRAT plugin.
- BRAT settings → Add beta plugin → paste this repo's URL.
Notes
- Renders in reading mode and in live preview once the cursor leaves the block.
- The simulation is intentionally lightweight (O(n²) repulsion); it is meant for idea-sized graphs of up to a few dozen nodes, not whole-vault visualization.
- Clicking nodes currently does nothing. Click-to-open-note is a planned option (see HANDOFF.md).
License
MIT
For plugin developers
Search results and similarity scores are powered by semantic analysis of your plugin's README. If your plugin isn't appearing for searches you'd expect, try updating your README to clearly describe your plugin's purpose, features, and use cases.