Obsidian Desmos 3D
A fork of Obsidian Desmos that adds 3D graphing support using Desmos 3D. Render both 2D and 3D mathematical graphs directly in your Obsidian notes.
Usage
Create a fenced codeblock with the language set to desmos-graph (2D) or desmos-graph-3d (3D). The block has two sections separated by ---: settings (optional) above the separator, and equations below it. If you have no settings, you can omit the --- and write equations directly.
Basic Structure
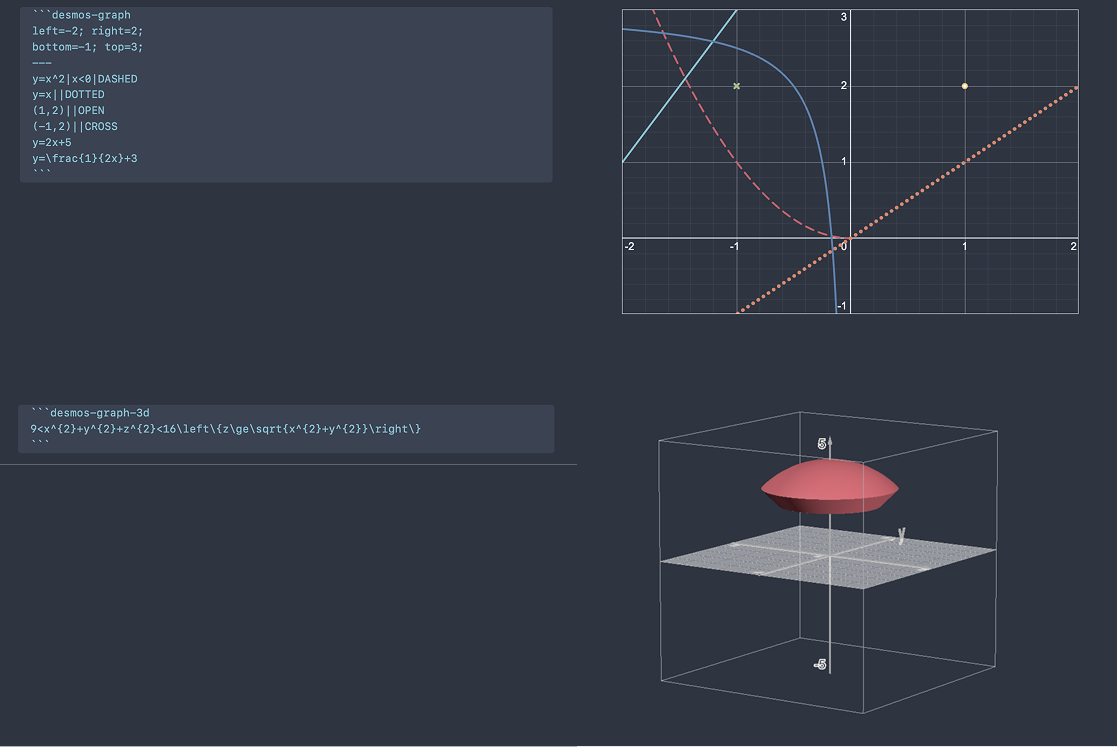
```desmos-graph-3d
setting1=value1; setting2=value2
---
equation1
equation2
```
Settings are key=value pairs separated by ; or newlines. Equations go one per line after the ---.
Settings
Common Settings (2D and 3D)
| Setting | Type | Default | Description |
|---|---|---|---|
width | number | 600 | Graph width in pixels |
height | number | 400 | Graph height in pixels |
degreeMode | radians / degrees | radians | Angle mode for trig functions |
defaultColor | color | — | Default color applied to all equations |
2D Settings (desmos-graph)
| Setting | Type | Default | Description |
|---|---|---|---|
left | number | -10 | Left boundary |
right | number | 10 | Right boundary |
bottom | number | -7 | Bottom boundary |
top | number | 7 | Top boundary |
grid | boolean | true | Show gridlines |
hideAxisNumbers | boolean | false | Hide axis tick labels |
xAxisLabel | string | — | Label for x-axis |
yAxisLabel | string | — | Label for y-axis |
xAxisLogarithmic | boolean | false | Logarithmic x-axis |
yAxisLogarithmic | boolean | false | Logarithmic y-axis |
3D Settings (desmos-graph-3d)
| Setting | Type | Default | Description |
|---|---|---|---|
showGrid | boolean | true | Show the grid |
showAxis | boolean | true | Show the axes |
xAxisLabel | string | — | Label for x-axis |
yAxisLabel | string | — | Label for y-axis |
zAxisLabel | string | — | Label for z-axis |
locked | boolean | false | Lock the graph to prevent interaction (enables caching) |
Equation Syntax
Each equation line follows this format:
expression|restriction|style|color|label:text
Segments are separated by |. Only the expression is required — everything else is optional and order-flexible.
Expressions
Write any valid Desmos expression:
y=x^2
x^2+y^2=1
9<x^{2}+y^{2}+z^{2}<16
Restrictions
Add conditions to limit where an equation is drawn:
y=x^2|x>0
y=\sin(x)|-5<x<5
Styles
| Style | Description |
|---|---|
SOLID | Solid line (default) |
DASHED | Dashed line |
DOTTED | Dotted line |
NOLINE | No line |
POINT | Filled point |
OPEN | Open (hollow) point |
CROSS | Cross point |
Colors
Use any named color or a hex code:
red, green, blue, yellow, magenta, cyan, purple, orange, black, white
y=x^2|blue
y=\sin(x)|#ff6600
If no color is specified, the plugin uses Obsidian's theme colors or Desmos defaults.
Labels
Add a label to an equation with the label: prefix:
(1,2)|POINT|label:Point A
Hidden Equations
Use the HIDDEN keyword to define an equation without displaying it (useful for helper expressions):
a=5|HIDDEN
y=a*x
Features
- Interactive 3D graphs — 3D graphs with
locked=false(the default) are fully interactive: rotate, zoom, and pan. Camera position is preserved between renders. - Cached graphs — Locked graphs and all 2D graphs are rendered as static images (SVG for 2D, PNG for 3D) and cached for performance.
- Theme integration — Graph axes and gridlines automatically match your Obsidian theme colors.
For plugin developers
Search results and similarity scores are powered by semantic analysis of your plugin's README. If your plugin isn't appearing for searches you'd expect, try updating your README to clearly describe your plugin's purpose, features, and use cases.