by haderlka
Turn any Markdown table into an interactive pivot table with a drag and drop field list, filters, subtotals and grand totals.
Pivot Tables
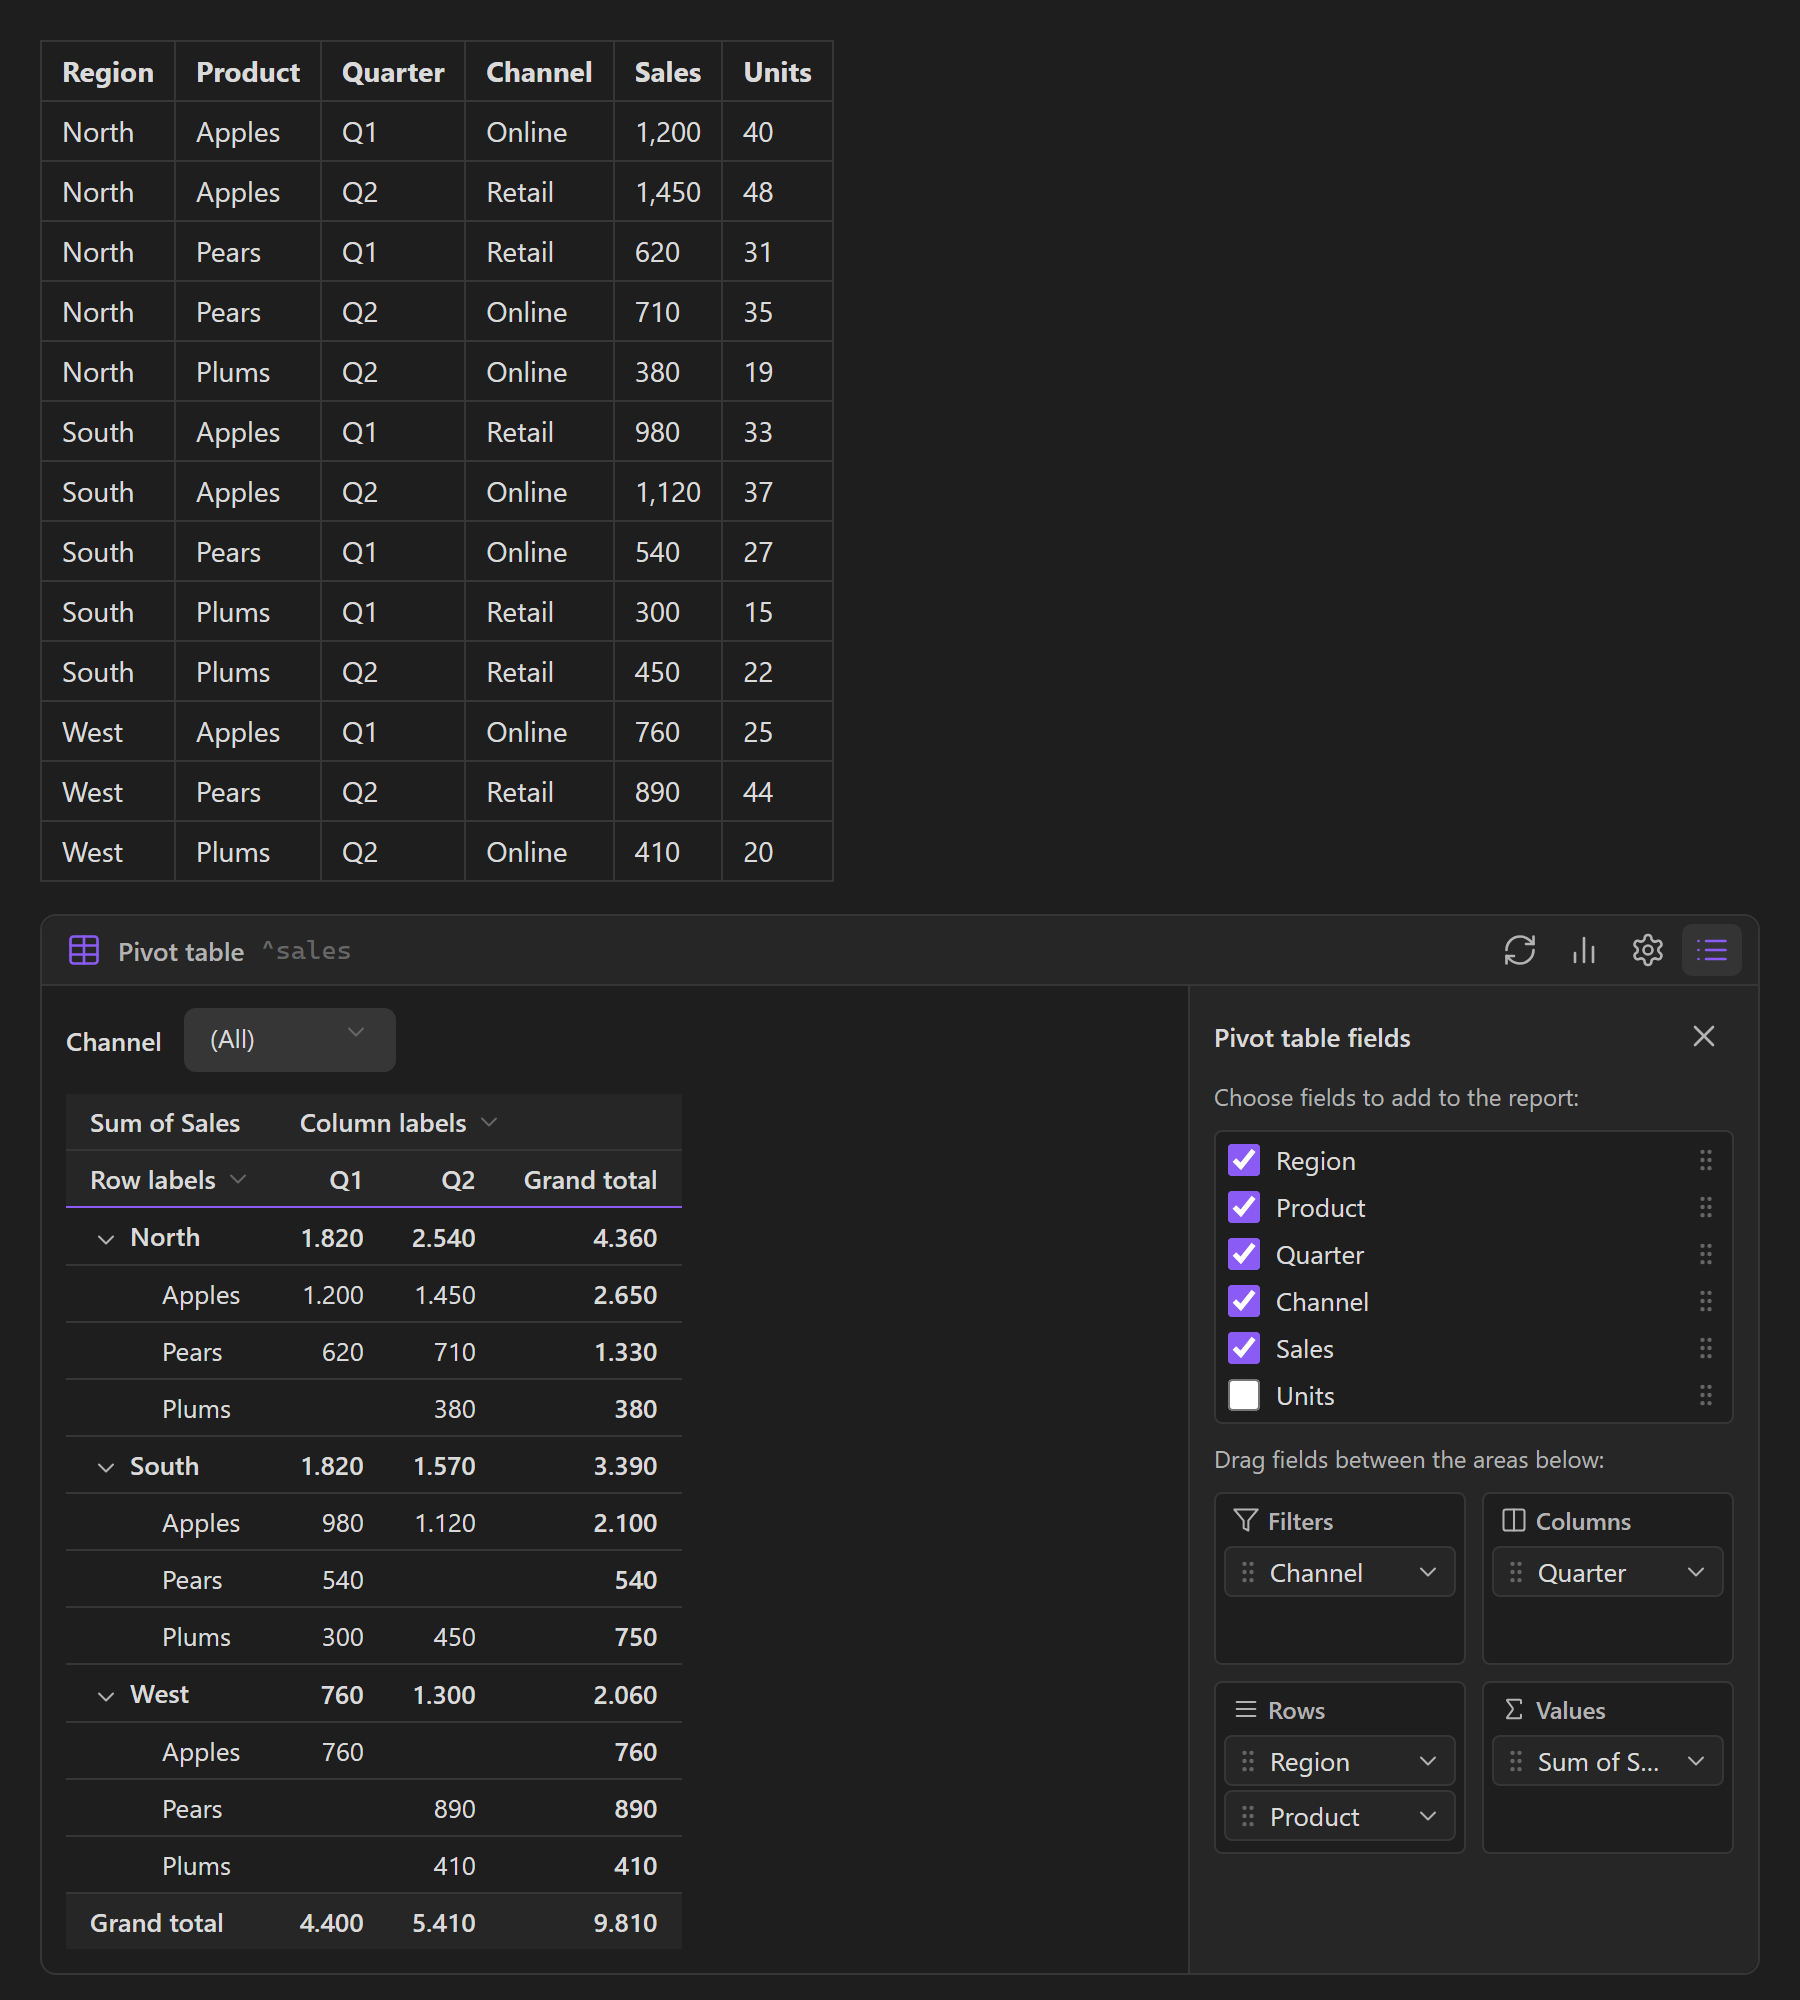
Pivot tables for the Markdown tables in your notes. Pick a table, then build the report with a field list that works like the one in Excel: tick fields, drag them between Filters, Columns, Rows and Values, and the pivot table updates right in the note. One more click turns it into a chart.
Source code: github.com/haderlka/obsidian-pivot-tables. Issues and ideas are welcome.
If this plugin is useful to you, you can support its development:

Features
- Your table stays a normal table. The pivot only refers to it, so you keep editing the data with Obsidian's table editor. Several pivots can use the same table, also from another note.
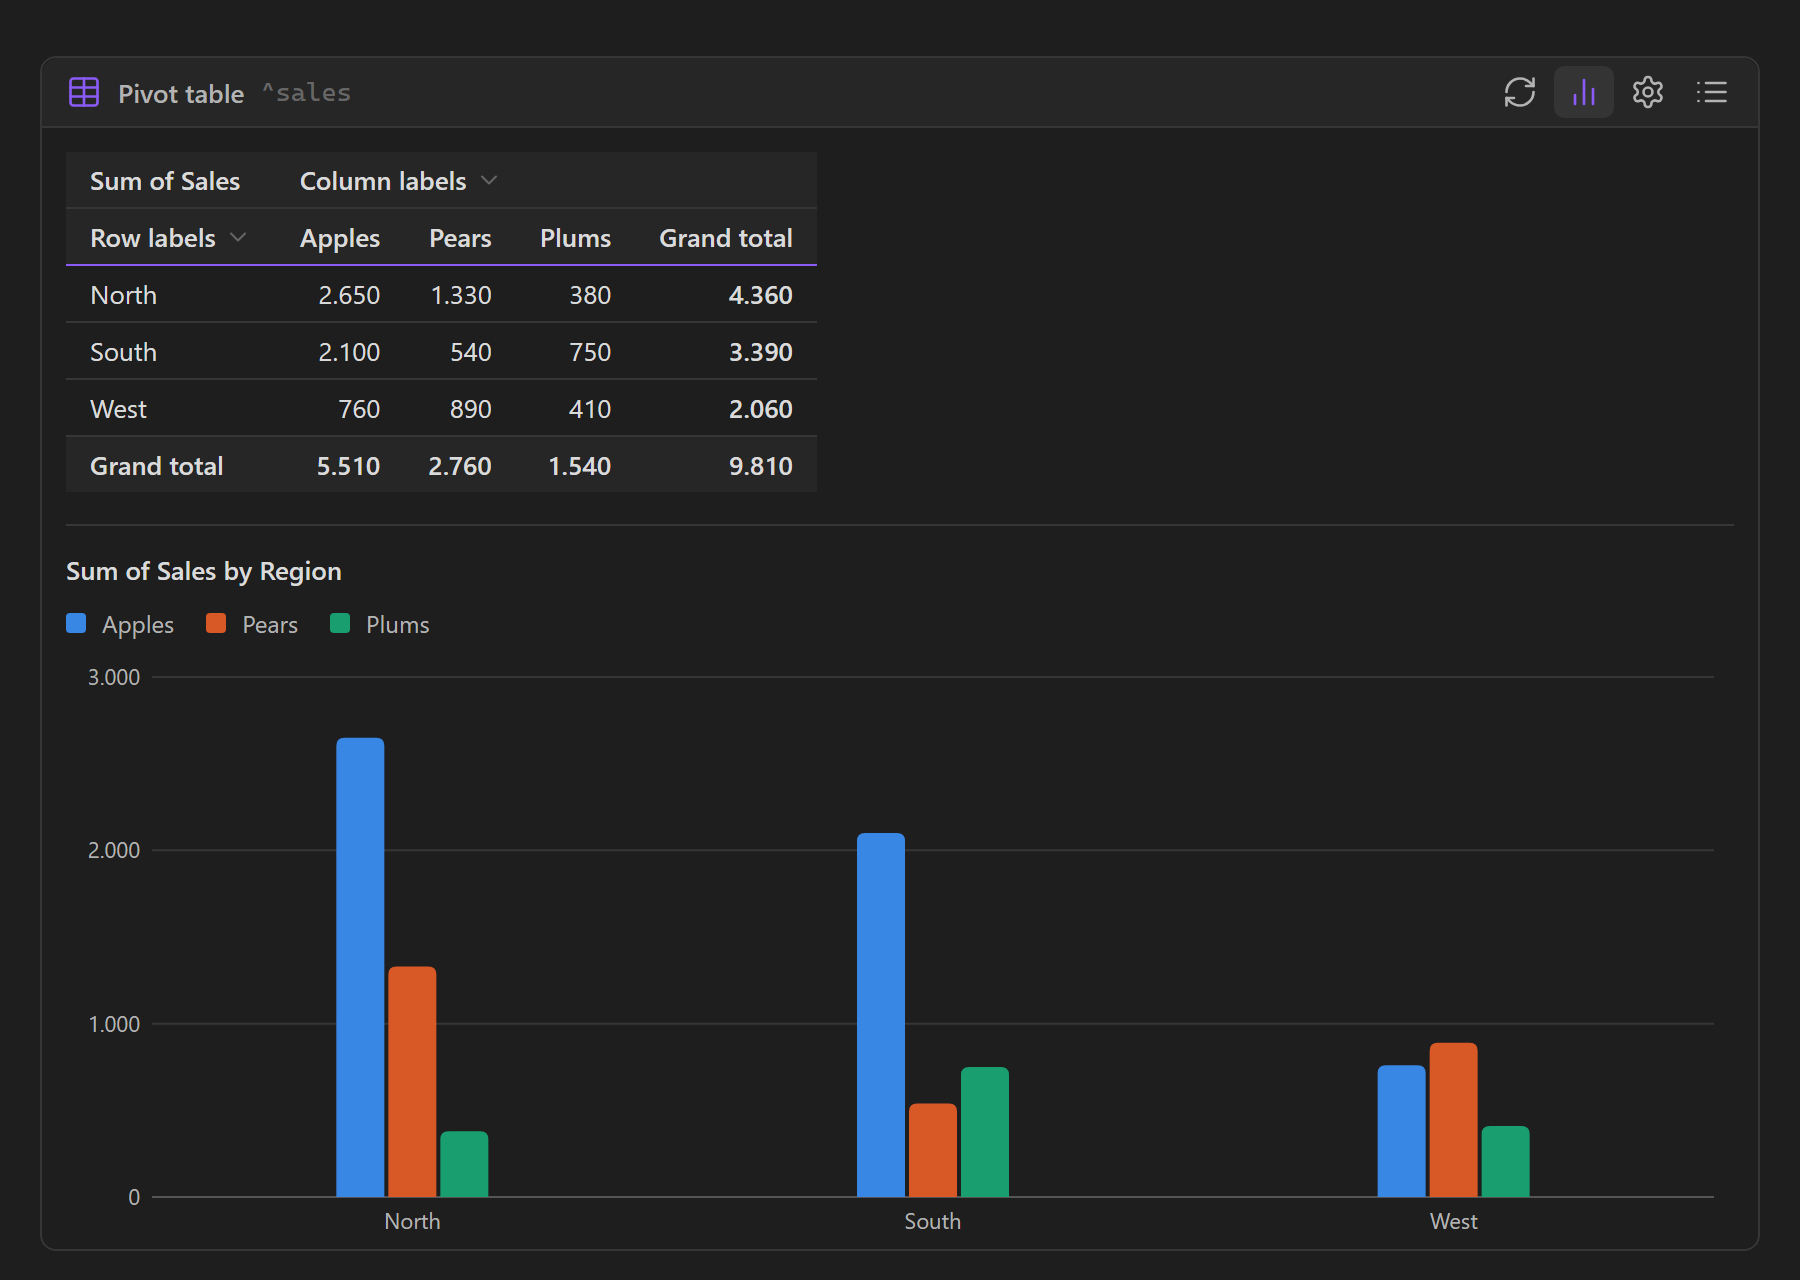
- Charts. Show any pivot as a column, stacked column, bar, line, pie or doughnut chart, right below the table. The chart follows your filters, sorting and collapsed groups, and shows the exact values when you hover it.
- Field list like in Excel. Tick a field to add it (numbers go to Values, everything else to Rows), or drag fields between the four areas. Drag a field out of an area to remove it.
- Values: Sum, Count, Average, Max, Min, Product, Count numbers, StdDev, StdDevp, Var and Varp. Show them as a percentage of the grand total, the column total or the row total. Custom names and decimal places.
- Filters: report filters above the table, and item filters on row and column labels, with search.
- Sorting: ascending or descending by label, or by a value.
- Groups: several row and column fields, with subtotals, grand totals, and expand and collapse.
- Live: the pivot follows the table as you edit it.
- Plain text. The layout is a few readable lines in a code block, which you can also write by hand.
- Works in Live Preview and Reading view, in light and dark themes, and on phones.
Usage
- Put the cursor in a table.
- Run the command Insert for the current table, or right-click and choose Insert pivot table.
The plugin gives the table a block id and adds a pivot block below it:
| Region | Product | Quarter | Sales |
| ------ | ------- | ------- | ----- |
| North  | Apples  | Q1      | 1,200 |
| South  | Pears   | Q2      | 540   |

^sales

```pivot
source: ^sales
```
The field list opens, and everything you do there is saved in the block:
```pivot
source: ^sales
filters: Channel
rows: Region, Product
columns: Quarter
values: Sum of Sales
```
The block, line by line
| Line | Meaning |
|---|---|
source: ^sales | The table with this block id. [[Other note#^sales]] uses a table in another note. Without a source line, the pivot uses the table above the block. |
filters:, rows:, columns: | Field names, separated by commas. |
values: Sum of Sales, Average of Units (% of row total; name: Share; decimals: 1) | What to calculate. The options in parentheses are optional. |
hide Region: North, West | Items that are filtered out. |
sort Region: descending by Sum of Sales | Sort order of a field. |
collapsed rows: North, South > Apples | Collapsed groups. Also collapsed columns:. |
grand totals: rows | rows, columns or off. Shown for both by default. |
subtotals: off | Hides subtotals. |
chart: column | Adds a chart: column, stacked column, bar, line, pie or doughnut. |
Names that contain a comma or parentheses go in double quotes.
Charts
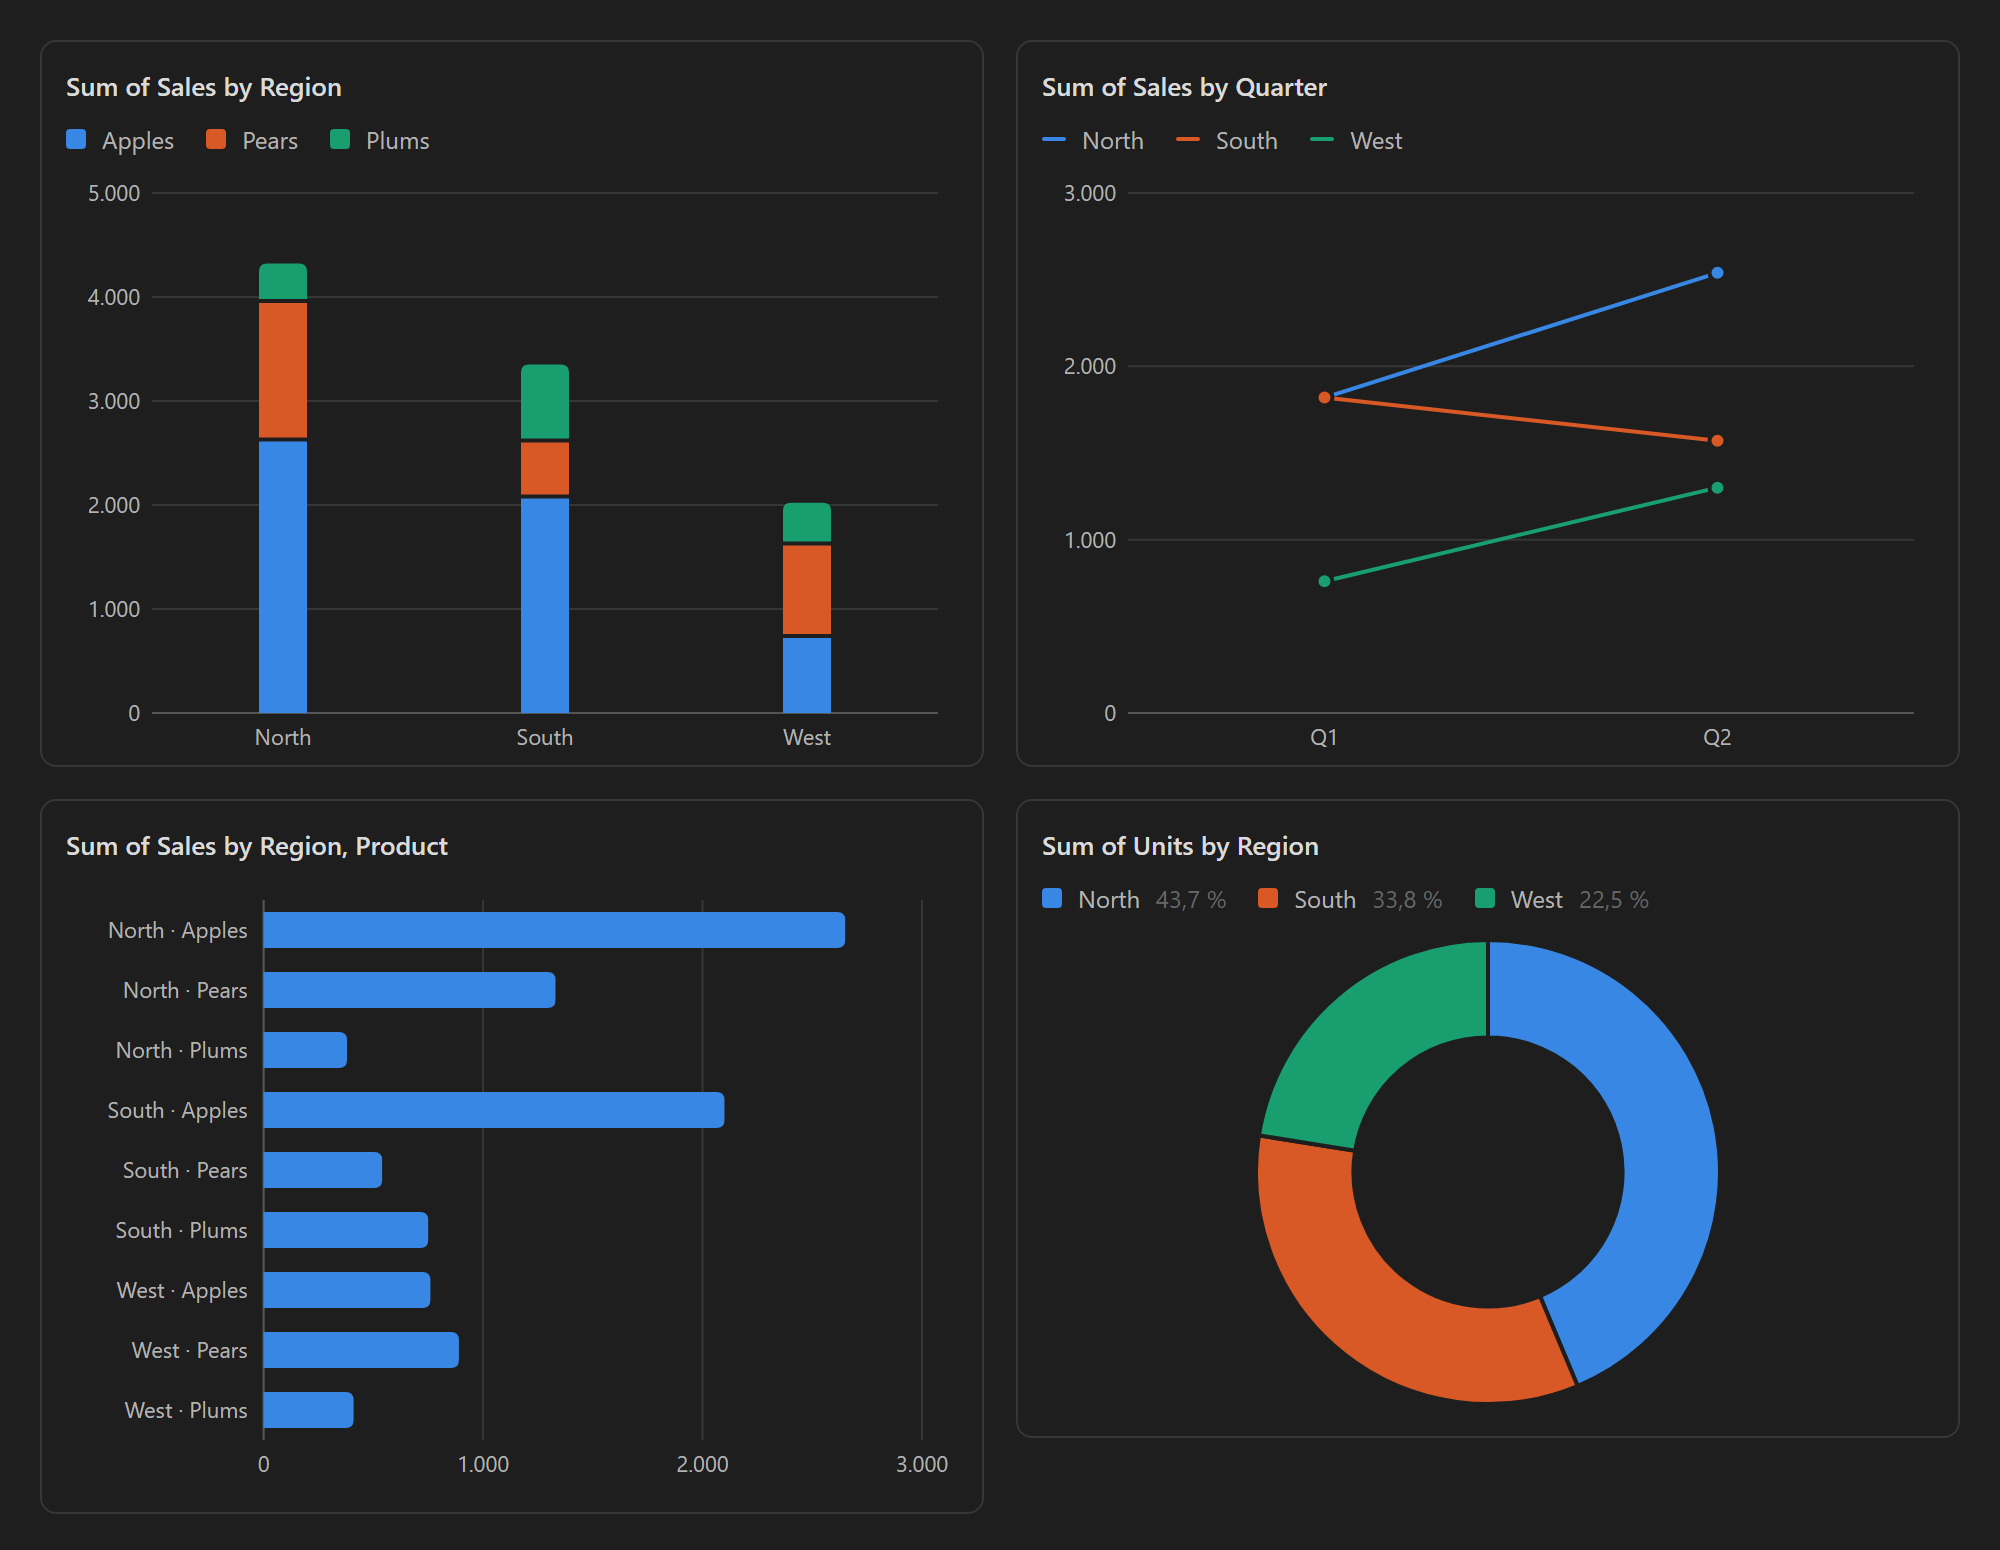
Click the chart button in the pivot's toolbar and pick a type. As in Excel, the rows become the categories on the axis, and the columns and values become the series. The chart shows what the table shows, so filters, sorting and collapsed groups apply to it too.
There is no limit on the number of series. The first eight get their own color; after that the same colors return in lighter and darker shades. A pie chart shows the first series.
Numbers
Cells like 1,234.50, 1.234,50, € 12, 15% and (3) count as numbers. A field is numeric when all of its non-empty cells are numbers.
Installation
Search for Pivot Tables in Settings → Community plugins → Browse, or copy main.js, manifest.json and styles.css from the latest release into <vault>/.obsidian/plugins/pivot-tables/.
Not included yet
Grouping dates into months or years, calculated fields, the tabular report layout, and values on rows.
License
For plugin developers
Search results and similarity scores are powered by semantic analysis of your plugin's README. If your plugin isn't appearing for searches you'd expect, try updating your README to clearly describe your plugin's purpose, features, and use cases.