SQLite DB
approvedby stfrigerio
Interact with local SQLite files in your notes
SQLite DB Plugin
The SQLite DB Plugin allows you to interact with SQLite databases directly within your Obsidian vault. You can execute SQL queries, generate charts from your data, inspect table structures, and even export table rows as notes.
Features
- SQL Query Execution
Write SQL queries in code blocks to fetch and render data from your SQLite database. - Natural Results Rendering
See query results rendered as natural lists or in a custom format directly in your note. - Multiple Filters & Date Range Filtering
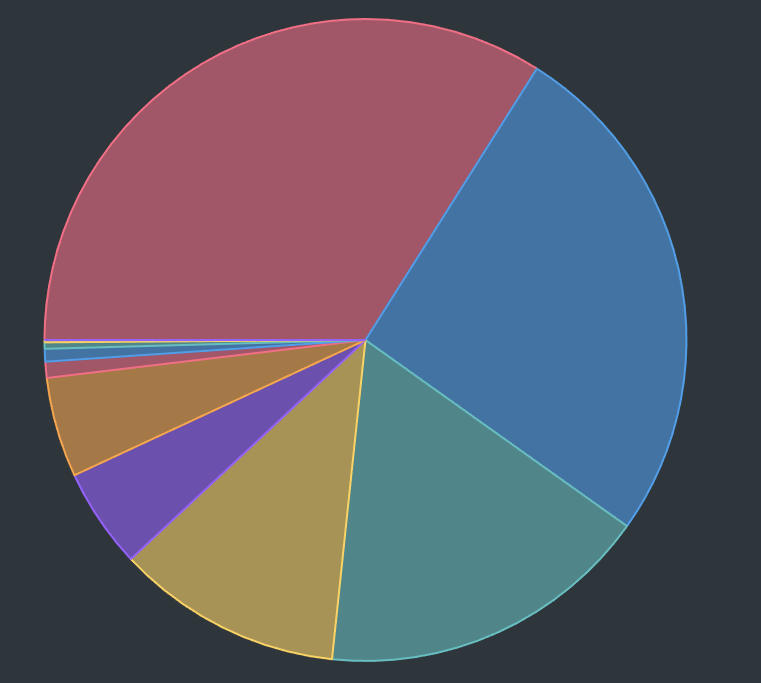
Easily add multiple filter conditions and date ranges to your queries. - Chart Visualization
Use thesql-chartcode block to create charts (pie, line, or bar) based on your data. - Table Inspection & Data Export
Inspect table structures and export table rows to new notes.
Configuration
- Open Obsidian Settings
Navigate to Community Plugins and disable Safe Mode. - Browse Community Plugins
Search for SQLite DB Plugin, then click Install. - Enable the Plugin
In your Community Plugins list, enable the plugin. - Download the .wasm file From the repository and put in the folder of the plugin (.obsidian/plugins/sqlite-db)
Once the plugin is installed, open Settings → SQLite DB Plugin to configure it. You can choose to work with either a local database file or a remote API, and optionally integrate with your daily notes or Cloudflare Access for secure API access.
🔀 Database Mode Choose whether the plugin interacts with a local SQLite file or a remote API server.
📁 Local Mode Settings Used when Database mode is set to Local. Here you can set your full absolute path to your .db SQLite file
🌐 Remote Mode Settings Used when Database mode is set to Remote. Ideal for syncing across devices or accessing a shared dataset via HTTP.
If you protect your API using Cloudflare Access, provide your Client ID and Client Secret here for automatic token-based login.
🗓️ Journal Settings These options help the plugin locate and manage your journal entries if you have some. This + the commands registered in the plugin allows you to dump the entries in your db into the folder or the other way round, upsert the journal you wrote in obsidian into your own DB.
This as other parts of the plugin requires you to setup a specific database schema for the tables
Usage
Codeblocks
SQL Code Blocks
Create a code block labeled with sql to run a SQL query. For example:
table: Tasks
columns: text, completed, due
filterColumn: completed, priority
filterValue: 0, high
dateColumn: due
startDate: 2024-01-01
endDate: 2024-12-31
orderBy: due
orderDirection: asc
limit: 10
This query will:
- Select the
text,completed, andduecolumns from theTaskstable. - Apply two filters: one on
completedand another onpriority. - Filter rows within the specified date range.
- Order the result by the
duecolumn in ascending order. - Limit the number of rows to 10.
Below is a list of available parameters you can use in your SQL blocks:
| Parameter | Description | Example |
|---|---|---|
table | Required. Name of the table to query. | table: Tasks |
columns | Comma-separated columns to select. | columns: id, text, due |
filterColumn | Column(s) to filter on. Can list multiple columns separated by commas. | filterColumn: completed, priority |
filterValue | Filter value(s) for the corresponding columns in filterColumn. | filterValue: 0, high |
dateColumn | Column containing date information for range filtering. | dateColumn: due |
startDate | Starting date for filtering. | startDate: 2024-01-01 |
endDate | Ending date for filtering. | endDate: 2024-12-31 |
orderBy | Column to order the results by. | orderBy: due |
orderDirection | Direction of sort (asc or desc). | orderDirection: asc |
limit | Maximum number of rows to return. | limit: 10 |
Chart Code Blocks
Create a code block labeled with sql-chart for visualizations. For example:
table: Time
chartType: pie
categoryColumn: tag
valueColumn: duration
Parameters
| Parameter | Description | Example |
|---|---|---|
chartType | Type of chart to create. | chartType: pie |
categoryColumn | Column to use for the category in the chart. | categoryColumn: priority |
valueColumn | Column to use for the value in the chart. | valueColumn: completed |
Each chart takes an optional chartOptions object that can be used to customize the different chart types:
Chart types
table: QuantifiableHabits
chartType: line

xColumn: date
yColumns: value
categoryColumn: habitKey

dateColumn: date
startDate: 2025-01-01
endDate: 2025-01-31

chartOptions: {
	fill: false,
	tension: 0.5,
	pointRadius: 4,
	showLegend: true,
	animations: true,
	yAxisMin: 0,
	yAxisMax: 10
}
table: QuantifiableHabits
chartType: bar

xColumn: date
yColumns: value
categoryColumn: habitKey

dateColumn: date
startDate: 2025-01-01
endDate: 2025-01-31

chartOptions: {
    stacked: true,
    horizontal: false,
    showLegend: true,
    animations: true,
    tooltips: true
}
table: Money
chartType: pie

categoryColumn: tag
valueColumn: amount

dateColumn: date
startDate: 2025-01-01
endDate: 2025-01-31

chartOptions: {
	showLegend: true,
	isDoughnut: true
}
Interactive Components
The plugin supports custom interactive HTML components you can embed in your notes to view and update data live. These components are initialized at runtime using your database settings. I wrote these to create interactive Periodic Notes, and update data in them accordingly
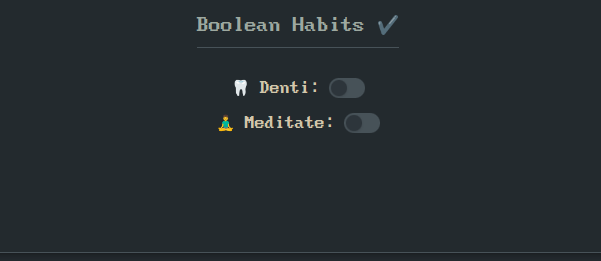
Boolean Switch
Use the component to create toggleable switches tied to boolean habit data. This lets you interact with your data directly from a note, such as marking a habit done or undone for a given day.
<span class="boolean-switch-placeholder"
  data-habit="Meditate"           <!-- the name of the habit in the db -->
  data-emoji="🧘"                 <!-- the emoji (only for display) -->
  data-date="2025-05-09"          <!-- the date associated with the specific row -->
  data-table="BooleanHabits"      <!-- the name of the table -->
  data-habit-id-col="habitKey"    <!-- the name of the column where the habit names are stored -->
  data-value-col="value"          <!-- the name of the column where the values are stored -->
  data-date-col="date">           <!-- the name of the column that holds the date -->
</span>
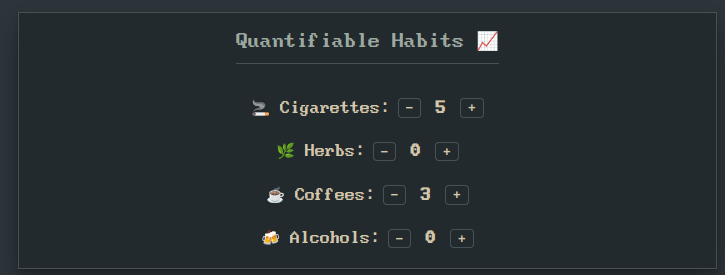
Habit Counter
Use the component to track numerical habits, such as how many coffees you had or how many cigarettes you smoked today.
<span class="habit-counter-placeholder"
  data-habit="Cigarettes"         <!-- the name of the habit in the db -->
  data-emoji="🚬"                 <!-- optional emoji for display -->
  data-date="2025-05-09"          <!-- the date associated with the specific row -->
  data-table="QuantifiableHabits" <!-- the name of the table -->
  data-habit-id-col="habitKey"    <!-- the column where the habit keys are stored -->
  data-value-col="value"          <!-- the column for storing numerical values -->
  data-date-col="date">           <!-- the column for storing dates -->
</span>
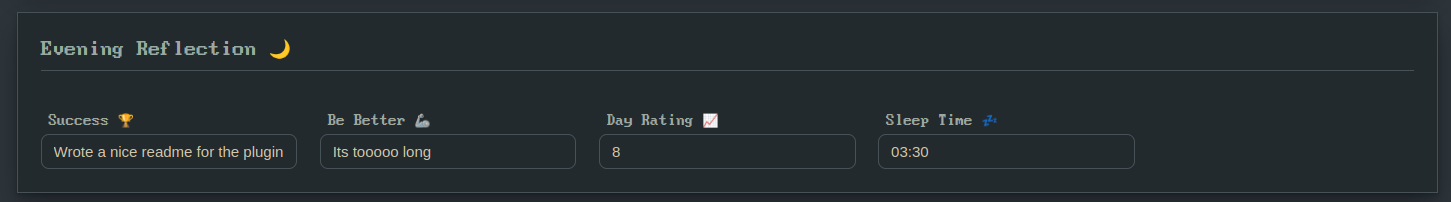
Text Input
Use the component to display and optionally update text fields in your database.
<span class="text-input-placeholder"
  data-table="DailyNotes"             <!-- Table where the value is stored -->
  data-date="@date"                   <!-- The date for the entry -->
  data-value-col="dayRating"          <!-- Column to store the input -->
  data-date-col="date"                <!-- Column storing the date -->
  placeholder="How do u feel today?"  <!-- Placeholder text when empty -->
  data-label="Day Rating 📈"          <!-- Label shown next to the input -->
/>
It supports both inline editing and a "button-triggered" modal input, making it versatile for journal prompts, mood logs, notes, or custom fields.
<span
  class="text-input-placeholder"
  data-table="DailyNotes"
  data-value-col="sleepTime"
  data-date-col="date"
  data-date="@date"
  data-is-button="true"              <!-- Makes it a button -->
  data-modal-type="time-picker"      <!-- On click opens a modal, time-picker or date-picker -->
  placeholder="Select Time"
  data-label="Sleep Time 💤"
/>
For plugin developers
Search results and similarity scores are powered by semantic analysis of your plugin's README. If your plugin isn't appearing for searches you'd expect, try updating your README to clearly describe your plugin's purpose, features, and use cases.