Plugin Observability Layer
unlistedby Hipepper
Observe which community plugins react to the active note, inspect runtime health, and stream activity to the terminal.
Plugin Observability Layer
Observe how Obsidian community plugins react to the active note, inspect their runtime health, and stream the session to the terminal in real time.
Why This Plugin Exists
Obsidian gives power users an incredibly composable plugin ecosystem, but it is still hard to answer practical runtime questions:
- Which community plugins reacted while I was viewing this note?
- Did any callback turn slow or throw?
- Can I watch those events outside the app while debugging a vault?
Plugin Observability Layer focuses on that operational gap. It adds a dedicated sidebar dashboard, records best-effort runtime activity for the current Markdown page, and mirrors the same activity to NDJSON so you can inspect it from the terminal.
Core Capabilities
- Page-aware observability for the active Markdown note
- Sidebar dashboard with per-page metrics, plugin health, and recent events
- Runtime classification for
ok,warn, anderrorhook outcomes - Best-effort instrumentation for common plugin registration paths, including commands, app events, DOM events, and Markdown processors
- NDJSON event logging for external tooling and terminal workflows
- Copy-ready tail command from inside the dashboard
- English and Chinese UI strings
- Desktop-only design for operational debugging workflows
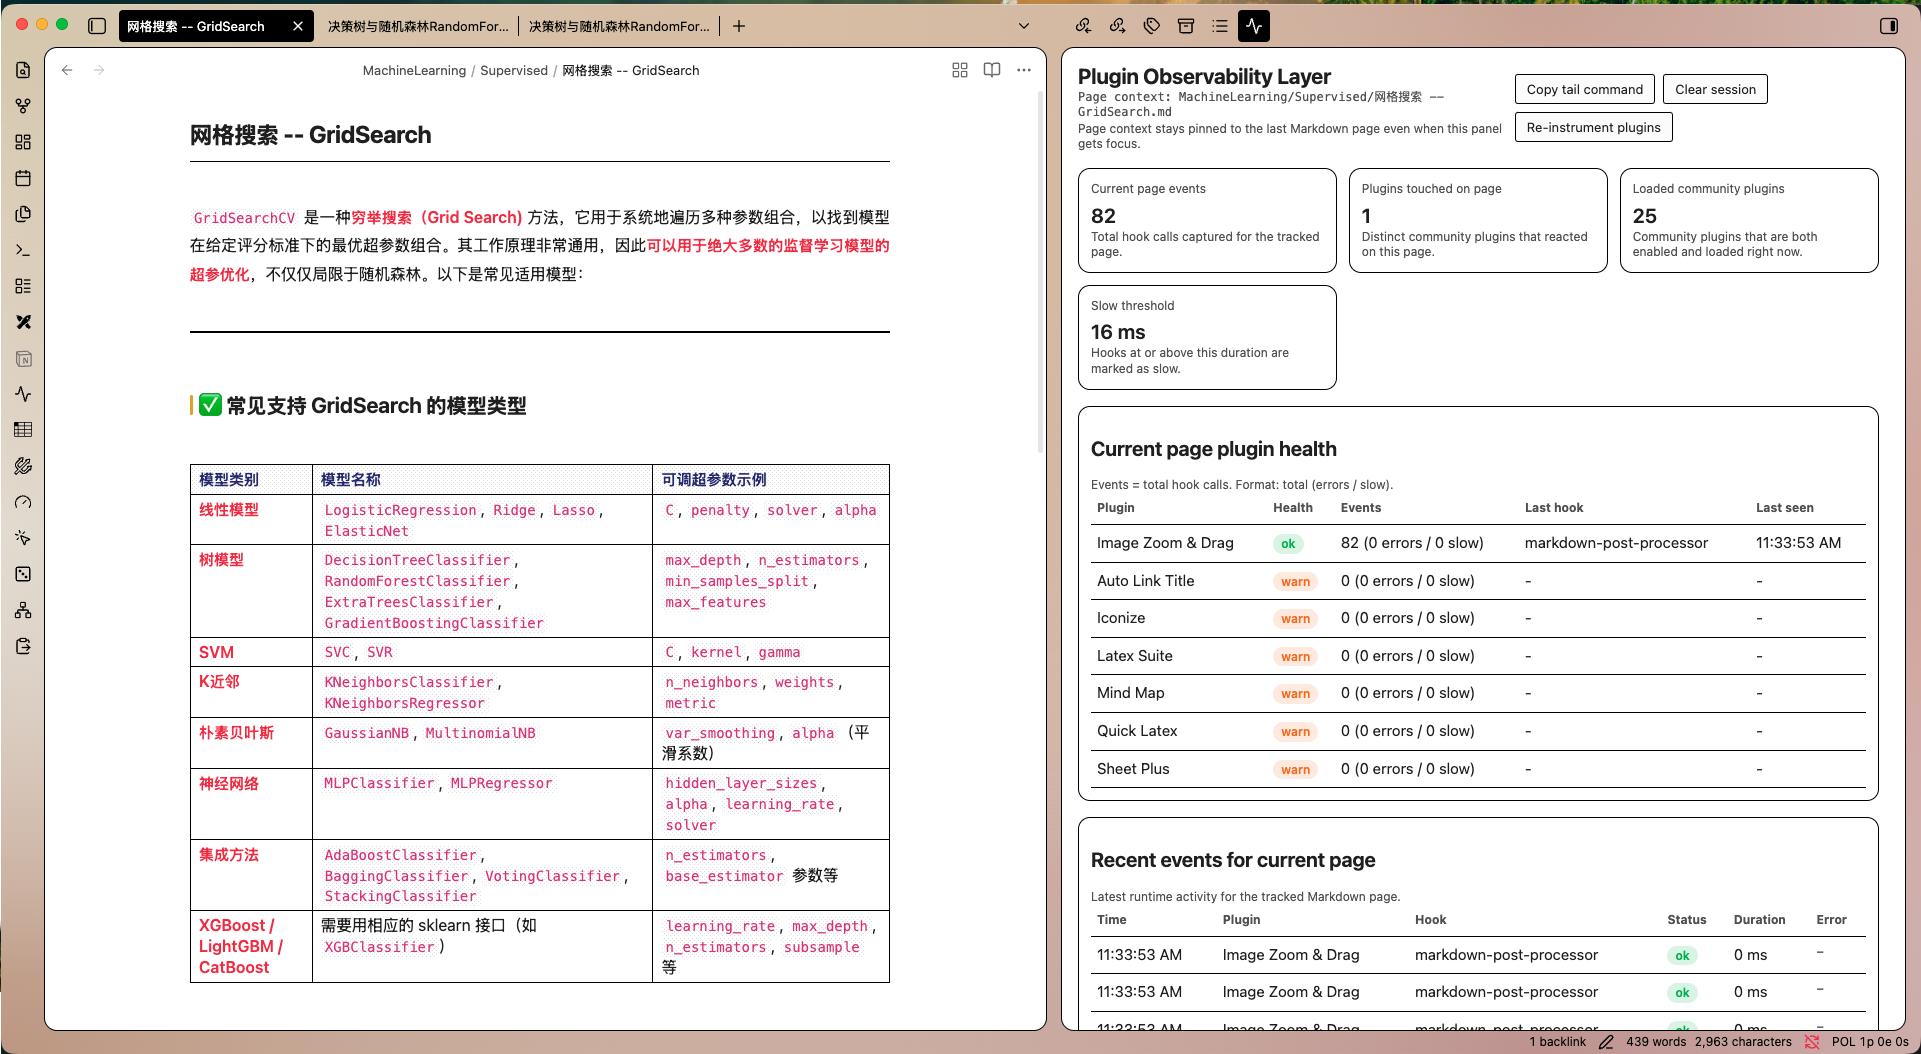
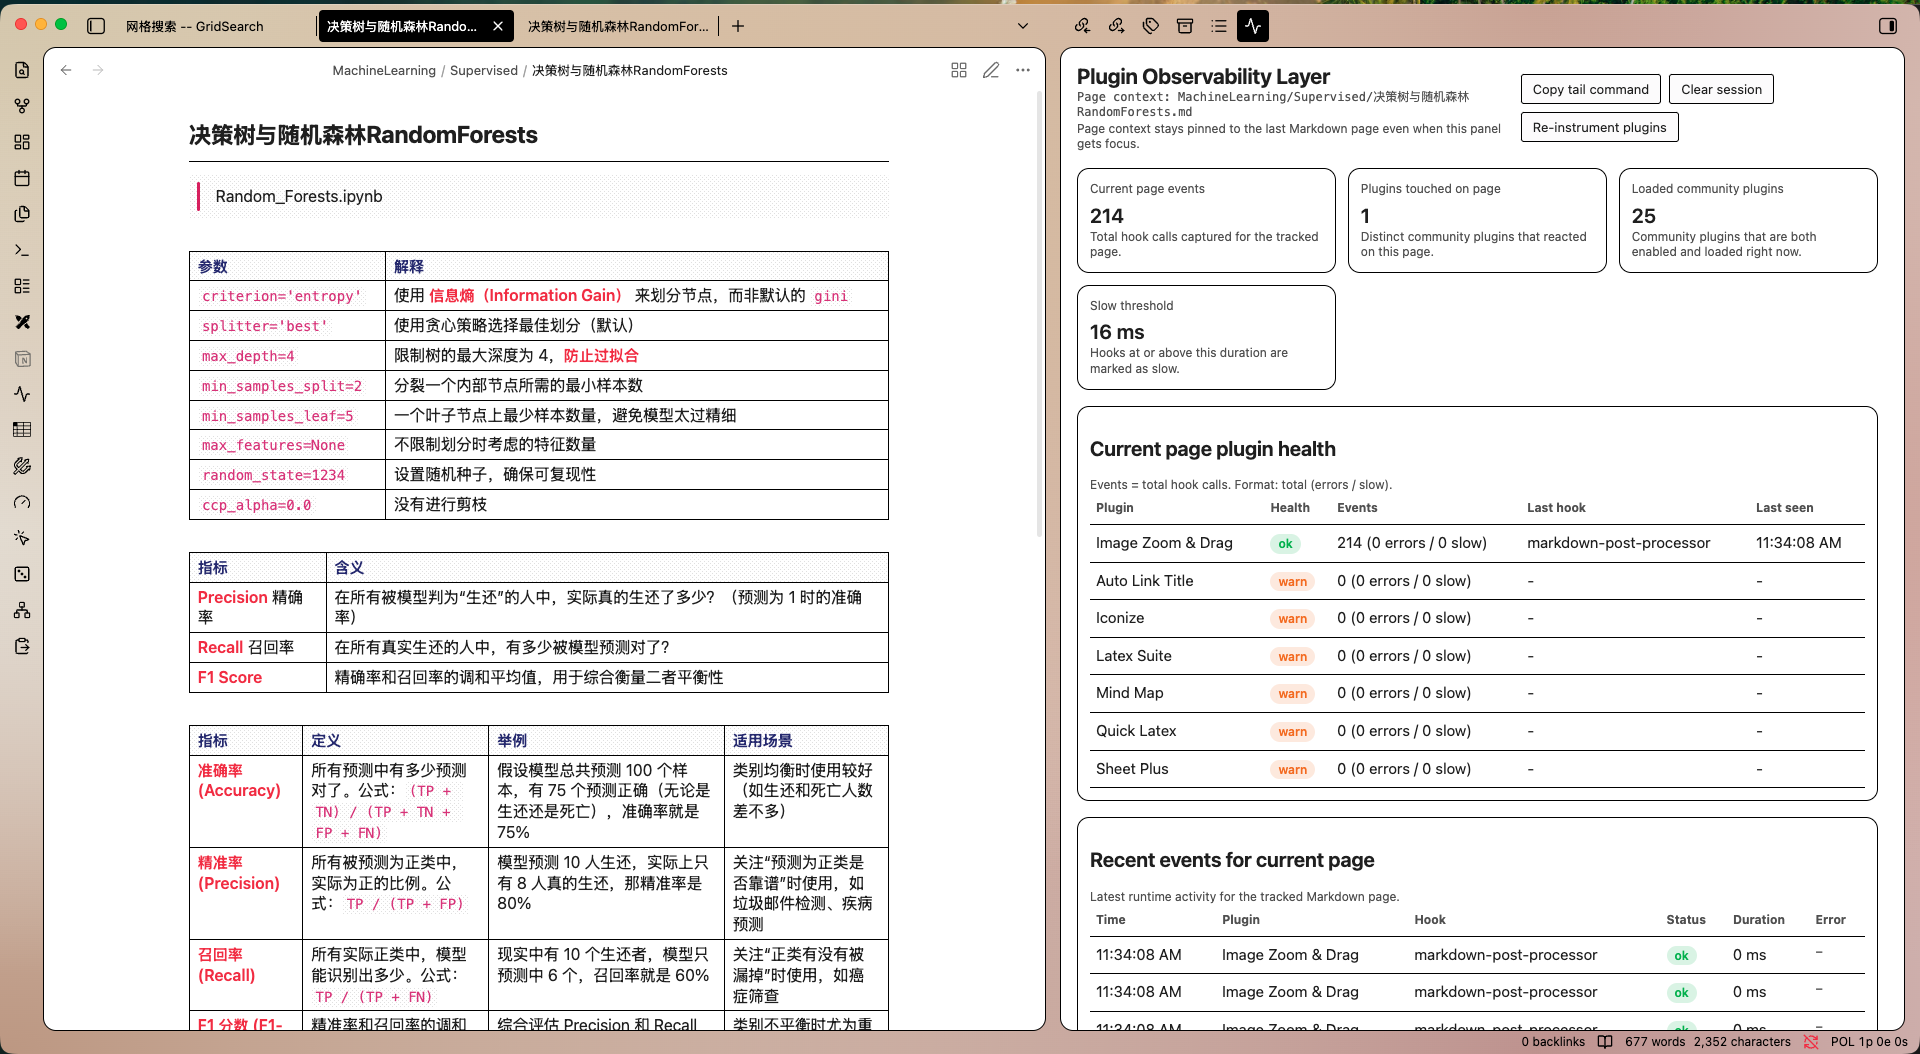
What You See In The Dashboard
Current page eventsTotal hook calls captured for the currently tracked note.Plugins touched on pageDistinct community plugins that reacted to the note.Loaded community pluginsPlugins that are both enabled and currently loaded.Slow thresholdThe latency threshold used to mark hook executions as slow.Current page plugin healthPer-plugin health, event totals, last observed hook, and last seen time.Recent events for current pageA rolling event stream with timestamp, hook source, duration, status, and error details.
How It Works
The plugin wraps common community plugin registration surfaces exposed through Obsidian APIs and records callback execution when those wrapped paths fire. It keeps the most recent Markdown page context pinned even if focus moves into the observability panel, which makes the dashboard usable during inspection.
Captured data can also be written to:
/.obsidian/plugins/plugin-observability-layer/runtime/events.ndjson
That file can be tailed by the included watcher script.
Installation
Community Plugins
Once the plugin is approved and published in the Obsidian Community Plugins directory, install it directly from:
Settings -> Community plugins -> Browse
Search for Plugin Observability Layer, install it, and enable it.
Manual Installation
-
Download
main.js,manifest.json, andstyles.cssfrom the matching GitHub release. -
Create this folder inside your vault:
.obsidian/plugins/plugin-observability-layer/ -
Copy the three release assets into that folder.
-
Reload Obsidian.
-
Enable
Plugin Observability Layerin Community Plugins.
Usage
- Open any Markdown note.
- Run
Plugin Observability Layer: Open dashboard. - Interact with the note, switch notes, or trigger commands.
- Inspect the dashboard cards, plugin health table, and recent event stream.
- Use
Copy tail commandif you want the equivalent terminal watcher command on your clipboard.
Also available:
Plugin Observability Layer: Clear session eventsPlugin Observability Layer: Re-instrument enabled community plugins
Terminal Watcher
Watch the vault runtime log:
node scripts/watch-log.mjs /path/to/vault
Or point directly at the NDJSON file:
node scripts/watch-log.mjs /path/to/vault/.obsidian/plugins/plugin-observability-layer/runtime/events.ndjson
Scope And Limitations
This plugin is an observability layer, not a perfect tracer.
- Obsidian does not provide one official API that says which plugin just ran for which page.
- Results are therefore best-effort and depend on whether a plugin uses instrumented registration paths.
- Plugins doing work outside those wrapped APIs may be partially visible or invisible.
- Reloading Obsidian after first install is recommended so instrumentation is active for the full session.
That trade-off is intentional: the plugin prioritizes actionable operational visibility for real vault debugging over claiming impossible precision.
Repository Layout
plugin-observability-layer/main.jsplugin-observability-layer/manifest.jsonplugin-observability-layer/styles.cssscripts/watch-log.mjsdocs/images/manifest.jsonversions.json
Release Readiness
This repository includes the root files expected for Obsidian community submission:
README.mdLICENSEmanifest.jsonversions.json
For the submission checklist and release flow, see:
License
MIT
For plugin developers
Search results and similarity scores are powered by semantic analysis of your plugin's README. If your plugin isn't appearing for searches you'd expect, try updating your README to clearly describe your plugin's purpose, features, and use cases.