Vault Dashboard
unlistedby Demo
Interactive dashboard with vault stats, knowledge graph, tag cloud, and recent files.
Vault Dashboard - Interactive Obsidian Knowledge Graph Plugin
Website · Getting started · Features · Documentation
Live Demo: https://outblade.github.io/obsidian-vault-dashboard/demo.html
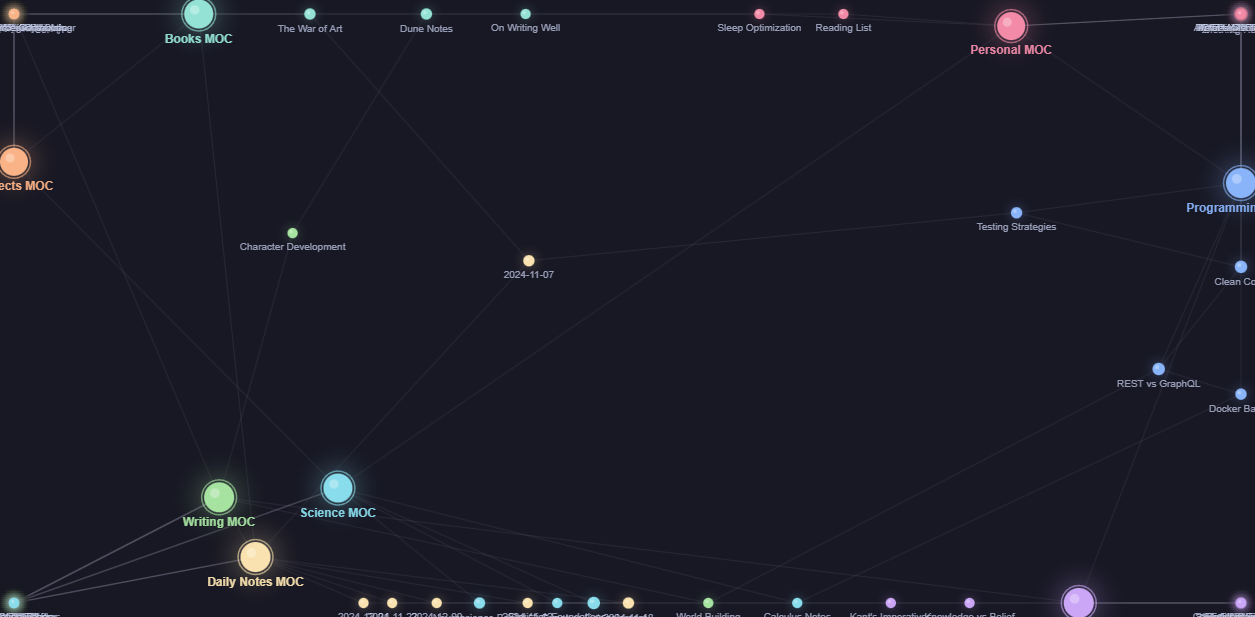
An Obsidian plugin that turns every new tab into a live analytics dashboard. Visualize your entire knowledge base as an interactive force-directed graph, track writing progress with real-time stats, explore your most-used tags, and navigate recently modified notes — all without leaving Obsidian.
Features
- Interactive Knowledge Graph: Force-directed graph with topic clustering — notes in the same folder attract each other into visible clusters
- Live Vault Stats: Real-time note count, estimated word count, total links, and unique tag count
- Tag Cloud: All tags scaled and weighted by frequency across your vault
- Recently Modified: The 10 most recently touched notes with relative timestamps and one-click navigation
- Drag and Zoom: Drag nodes to reposition, scroll to zoom, pan freely across the graph
- Hub Detection: MOC and highly-connected notes are automatically larger and ringed
- Topic Filtering: Click any legend entry to dim or hide an entire topic cluster
- Node Tooltips: Hover any node to see note name, topic, connection count, tags, and word count
- Open Notes Directly: Double-click any node to open that note in Obsidian
- Auto-Refresh: All panels update automatically as you create, delete, or rename notes
- Configurable: Adjust max graph nodes and label visibility from plugin settings
Live Demo
Try the browser simulation now: Vault Dashboard Live Demo
What you can do:
- Explore an 88-note synthetic vault across 8 topic clusters
- Drag nodes and watch the physics simulation react
- Scroll to zoom in on dense clusters and read node labels
- Click legend entries to isolate or hide topics
- Double-click any node to inspect its metadata
- Hit "Simulate Writing" to watch notes get added in real time
Technology Stack
- Frontend: TypeScript, HTML5 Canvas API, CSS3
- Physics Engine: Custom force-directed simulation (repulsion + spring + clustering forces)
- Obsidian API: MetadataCache, Vault events, ItemView, Plugin settings
- Build Tools: esbuild, Node.js, npm
- Deployment: GitHub Pages (browser demo)
Installation
Prerequisites
Quick Start
# Clone the repository
git clone https://github.com/OutBlade/obsidian-vault-dashboard.git
cd obsidian-vault-dashboard

# Install dependencies
npm install

# Build the plugin
npm run build
Copy the three output files into your vault's plugin folder:
cp main.js manifest.json styles.css "<YourVault>/.obsidian/plugins/vault-dashboard/"
Then in Obsidian: Settings → Community plugins → enable Vault Dashboard
A grid icon appears in the ribbon. You can also open it via the command palette: Open Vault Dashboard.
Development Mode
# Watch for changes and rebuild automatically
npm run dev
Usage
Opening the Dashboard
// The plugin registers a ribbon icon and a command
// Ribbon: click the grid icon in the left sidebar
// Command palette: "Open Vault Dashboard"

// The view opens as a new tab and stays in sync with your vault
Interacting with the Graph
// Drag a node to reposition it — physics resumes on release
// Scroll wheel to zoom in/out
// Click and drag the background to pan
// Double-click a node to open that note in Obsidian
// Hover a node for a metadata tooltip
// Click a legend color to dim/hide that topic cluster
Plugin Settings
// Settings → Community plugins → Vault Dashboard → Options

const settings = {
  maxNodes: 150,      // Top-N notes by link count shown in graph
  showLabels: true,   // Toggle note name labels on the graph
};
Advanced Graph Configuration
// The force simulation uses three forces:
// 1. Repulsion — all node pairs push apart (prevents overlap)
// 2. Spring edges — linked notes attract each other
// 3. Clustering — same-topic notes softly attract each other

// Hub notes (MOCs, high-degree nodes) are automatically detected:
// radius = 9 + min(degree, 12) * 0.5
// Regular notes: radius = 4 + min(degree, 12) * 0.55
Project Structure
obsidian-vault-dashboard/
├── src/
│   └── main.ts           # Full plugin source (view, simulation, settings)
├── demo.html             # Standalone browser demo — no build required
├── styles.css            # Plugin stylesheet (uses Obsidian CSS variables)
├── manifest.json         # Obsidian plugin manifest
├── package.json          # npm dependencies and build scripts
├── tsconfig.json         # TypeScript configuration
├── esbuild.config.mjs    # esbuild bundler configuration
├── screenshot.png        # Dashboard preview
└── README.md             # This file
Roadmap
- Phase 1: Folder-based automatic topic coloring
- Phase 2: Graph timeline — animate how the vault grew over time
- Phase 3: Writing streaks and daily word count chart
- Phase 4: Orphan note detection and link suggestions
- Phase 5: Export graph as SVG/PNG
Contributing
Contributions are welcome! Here's how to get started:
- Fork the repository
- Create a feature branch (
git checkout -b feature/your-improvement) - Commit your changes (
git commit -m 'Add your improvement') - Push to the branch (
git push origin feature/your-improvement) - Open a Pull Request
Development Setup
# Clone and set up
git clone https://github.com/OutBlade/obsidian-vault-dashboard.git
cd obsidian-vault-dashboard
npm install

# Start watch mode
npm run dev

# Copy output to your test vault
cp main.js manifest.json styles.css "<TestVault>/.obsidian/plugins/vault-dashboard/"
Code Style
- TypeScript strict null checks enabled
- Obsidian API types for all vault/workspace interactions
- Canvas rendering isolated in a single
draw()method - Force simulation in a pure function with no side effects
Related Projects
- Obsidian - The note-taking app this plugin is built for
- Obsidian Graph View - Obsidian's built-in graph
- D3.js - Inspiration for the force simulation approach
- Dataview - Popular Obsidian data plugin
Acknowledgments
- Obsidian for the excellent plugin API and documentation
- D3.js for force simulation concepts and inspiration
- Catppuccin for the color palette used in the demo
- The Obsidian community for plugin development patterns and best practices
License
This project is licensed under the MIT License — see the LICENSE file for details.
Links
- Live Demo: https://outblade.github.io/obsidian-vault-dashboard/demo.html
- GitHub Repository: https://github.com/OutBlade/obsidian-vault-dashboard
- Obsidian Plugin Docs: https://docs.obsidian.md/Plugins/Getting+started/Build+a+plugin
- Report Issues: https://github.com/OutBlade/obsidian-vault-dashboard/issues
Made with passion by OutBlade
Tags: Obsidian plugin, knowledge graph, vault dashboard, PKM, note-taking, force-directed graph, second brain, Obsidian analytics
For plugin developers
Search results and similarity scores are powered by semantic analysis of your plugin's README. If your plugin isn't appearing for searches you'd expect, try updating your README to clearly describe your plugin's purpose, features, and use cases.