Contribution Graph
approvedby vran-dev
Generate an interactive heatmap to visualize and track your productivity.
★ 435 stars↓ 51,691 downloadsUpdated 1y agoApache-2.0
English | 中文文档
What
Contribution Graph is a plugin for obsidian.md which can generate interactive heatmap graphs like GitHub to track your notes, habits, activity, history, and so on.

Use Cases
- Habit Tracker: Count the number of tasks you complete every day. Different numbers will be marked in different colors.
- Note Tracker: Count the number of notes you create every day. Different numbers will be marked in different colors.
- Review Report: Count your notes or tasks for a certain period of time and generate a heat map for a more intuitive review
- and more...
Quick Start
- Create empty note, then right-click
- Select Add Heatmap options
- Click the
savebutton, and then a heatmap will be created in note.
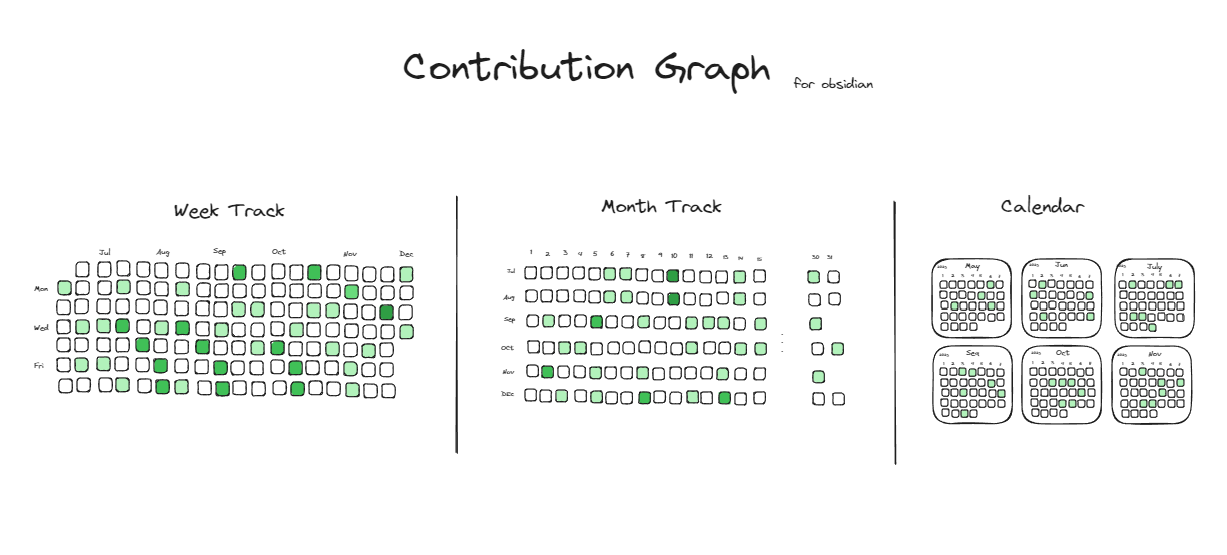
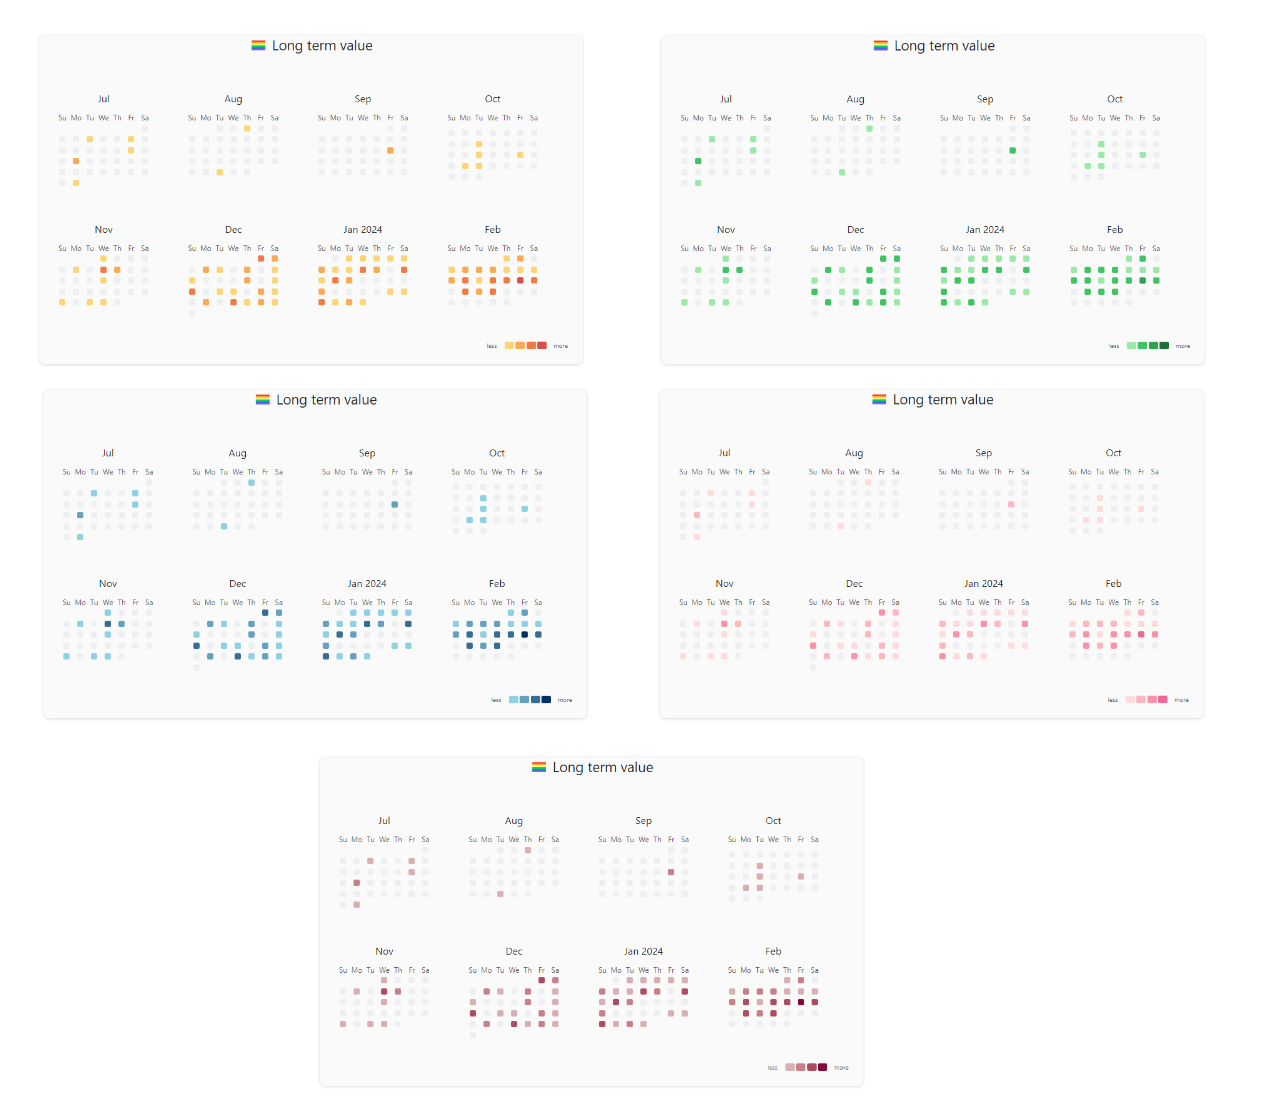
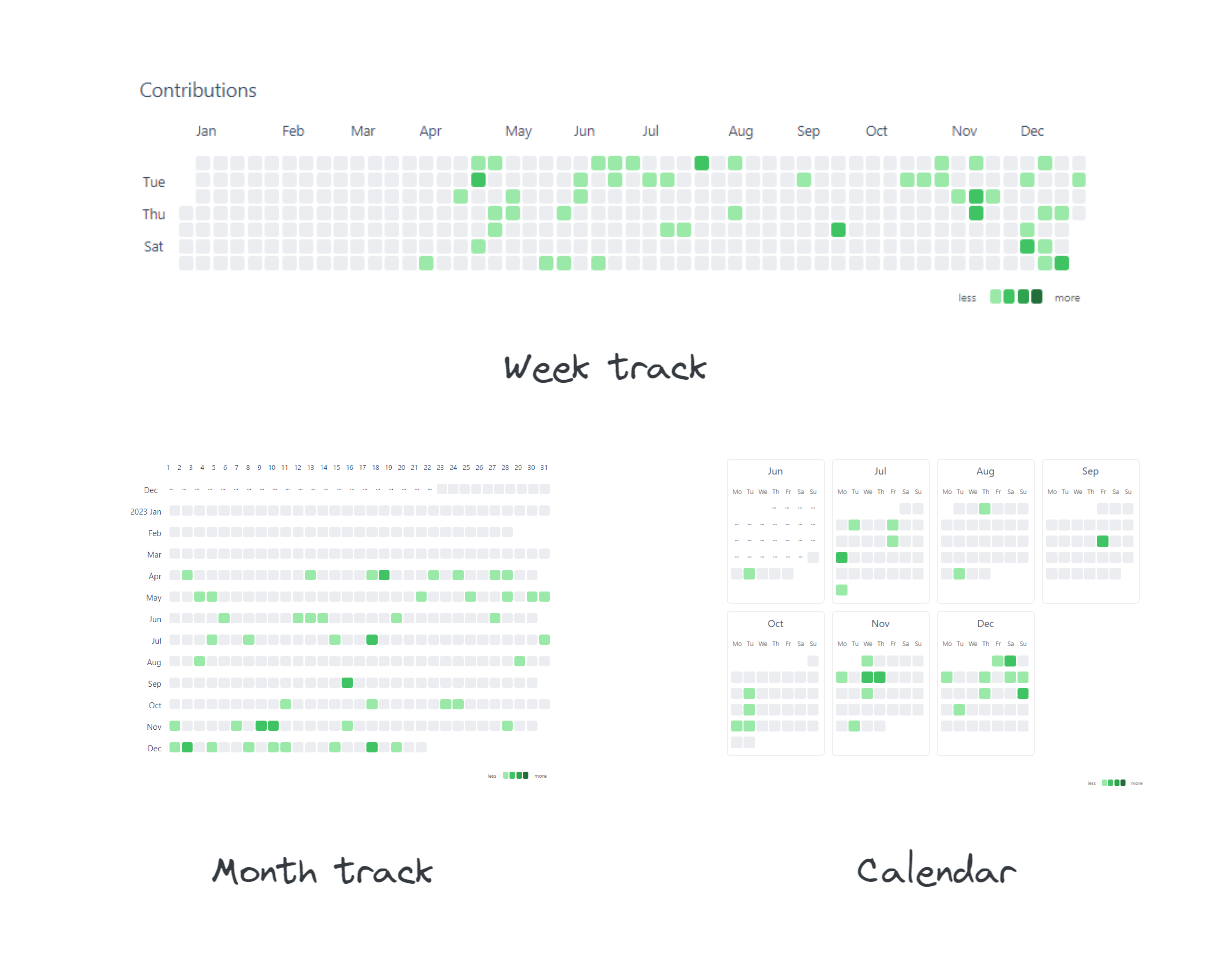
Themes
- Git Style
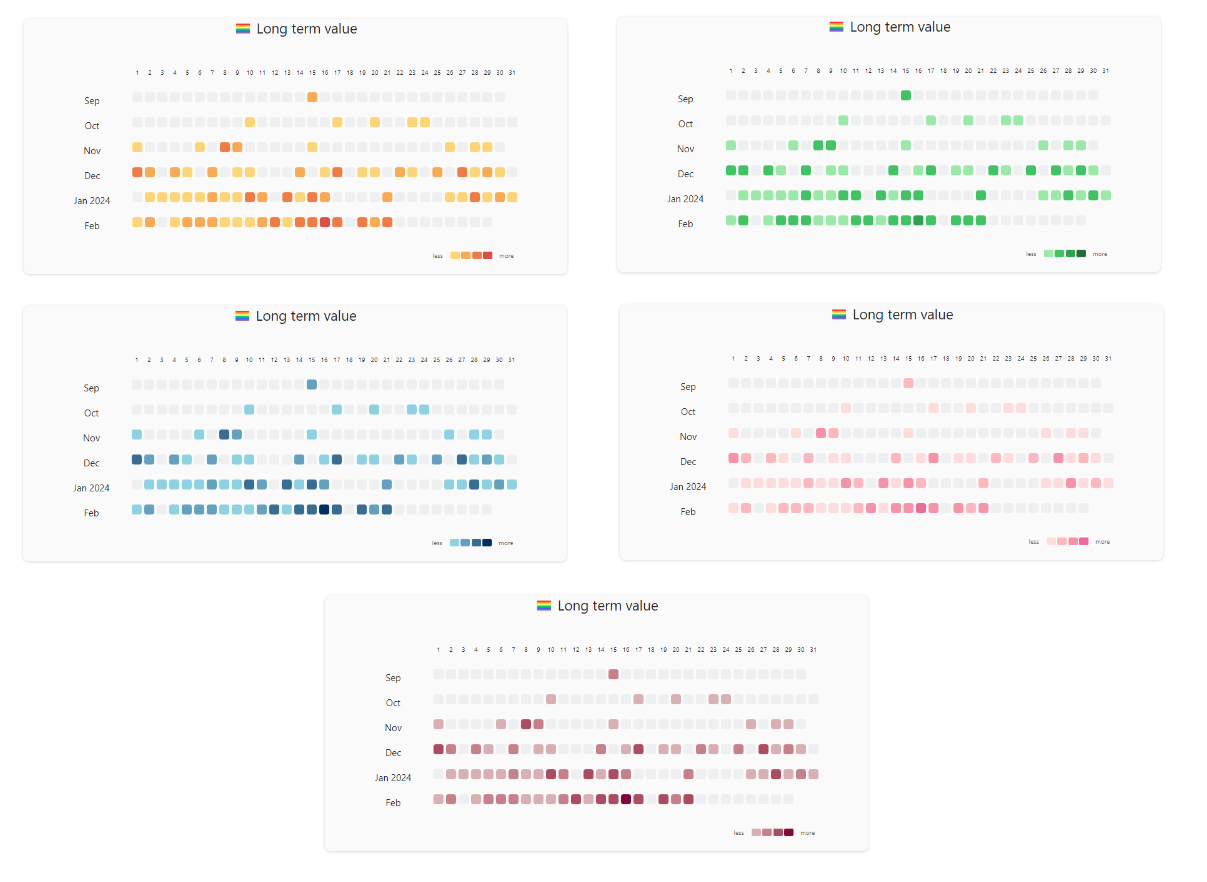
- Month Track
- Calendar
Features
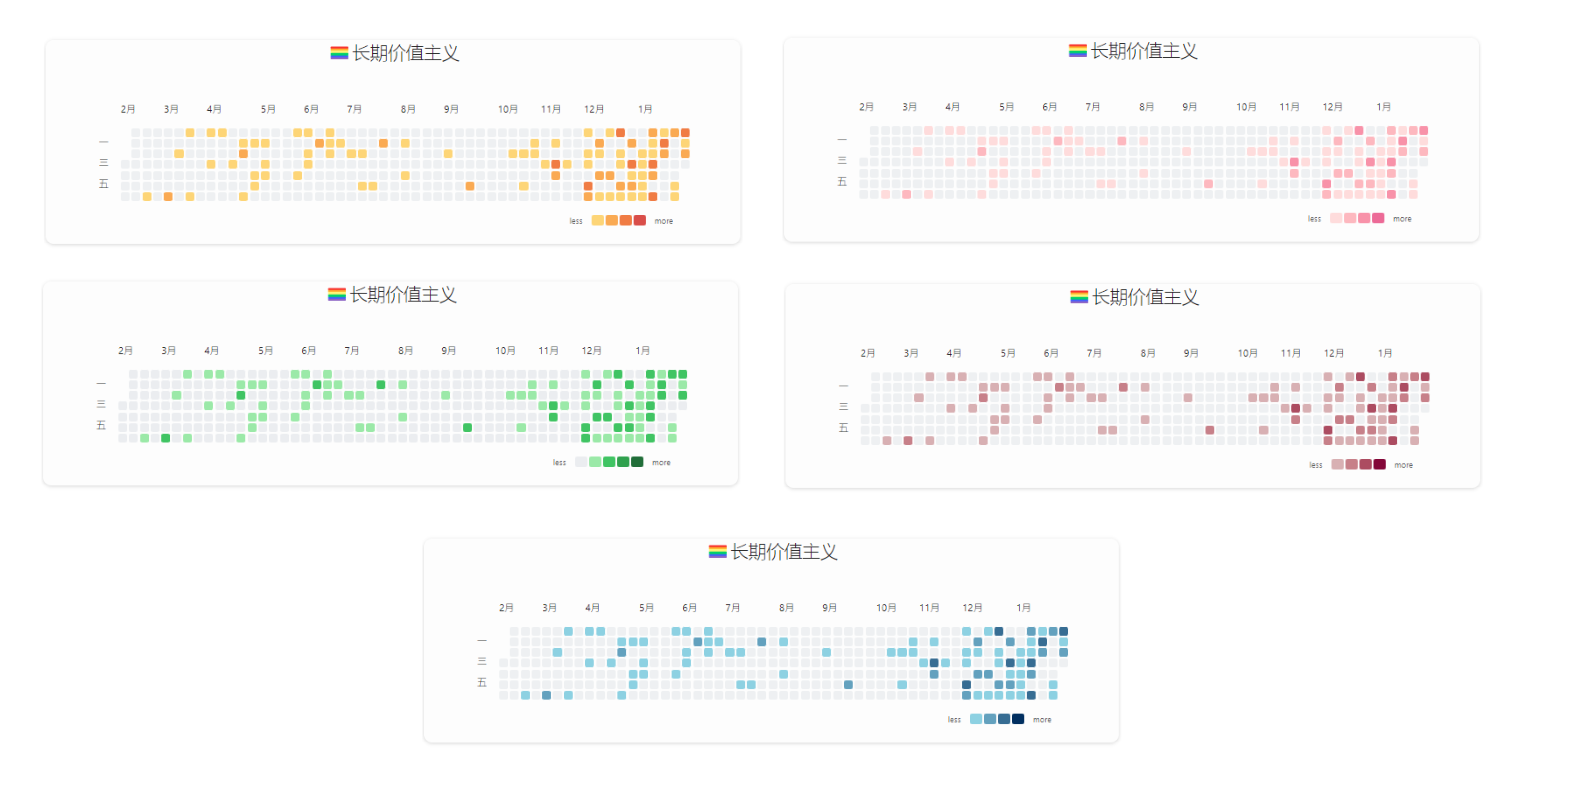
- Multiple graph types, support week-track(default), month-track, and calendar view.
- Personalized style, you can configure cell colors and fill cells with emojis.
- Customizable dates,use fixed date range or latest date to generate graph
- Interactive charts, you can customize cell click event, hover to show statistic data
- Integrate with DataviewJS, use contribution graph's api to dynamically render charts
How to Modify Graph?
Just click the edit button at top right corner
Configurations
| name | description | type | default | sample | required |
|---|---|---|---|---|---|
| title | the title of the graph | string | Contributions | false | |
| titleStyle | the style of the title | object | false | ||
| days | Maximum number of days for the chart to display (starting from today) | number | 365 | true if miss fromDate and toDate | |
| fromDate | The start date of the chart | date, format yyyy-MM-dd | 2023-01-01 | true if miss days | |
| toDate | The end date of the chart | date, format yyyy-MM-dd | 2023-12-31 | true if miss days | |
| query | dataview query syntax, contribution graph will use it to count files | string | true | ||
| dateField | Date attributes of files used for data distribution | string | file.ctime | createTime | false |
| startOfWeek | start of week | number | 0 | false | |
| showCellRuleIndicators | Control the display and hiding of cell rule indicator elements | boolean | true | false | |
| cellStyleRules | cell style rule | array | false |
More Usage Guides
For plugin developers
Search results and similarity scores are powered by semantic analysis of your plugin's README. If your plugin isn't appearing for searches you'd expect, try updating your README to clearly describe your plugin's purpose, features, and use cases.