Fancy Charts
approvedby Roberto Allende
Interactive charts inside any note. The data lives as a plain Markdown table inside each block — readable and AI-friendly even without the plugin. - This plugin has not been manually reviewed by Obsidian staff.

Fancy Charts
Charts that live where your notes do.
Why
I really missed a modern chart plugin in Obsidian that would allow me to have self-contained blocks so I can use Obsidian to visualize data — and at the same time fit well with my AI flow. Fancy Charts not only produces clean visualizations, it also provides a clean format for data. Inside each block, the data lives as a plain Markdown table: easy to read and edit even without the plugin installed.
Features
- Charts embedded directly in notes — render inline alongside your content, no separate view required
- Eight chart types — bar, line, pie, scatter, area, funnel, heatmap, sankey
- Simple mode — a short YAML config and a plain Markdown table is all you need; the plugin builds the chart automatically
- Advanced mode — pass a raw ECharts option object for full control over every chart property
- Chart builder modal — insert or edit charts through a form with a live preview; no hand-editing the block unless you want to
- Human-readable format — the data is a standard Markdown table; legible in any text editor, even without the plugin installed
- Dark and light mode — follows Obsidian's active theme automatically
Installation
From within Obsidian:
- Go to Settings → Community plugins → Browse
- Search for Fancy Charts
- Click Install, then Enable
Usage
Insert a chart
- Run Fancy Charts: Insert chart from the command palette, or
- Click the Fancy Charts ribbon icon
The chart builder modal opens. Choose a chart type, fill in the data table, set an optional title and axis, then click Insert. A fancy-charts block is written into your note and rendered immediately.
Edit a chart
Click the edit button that appears on a rendered chart to reopen the modal pre-filled with the existing data. Make your changes, then click Update.
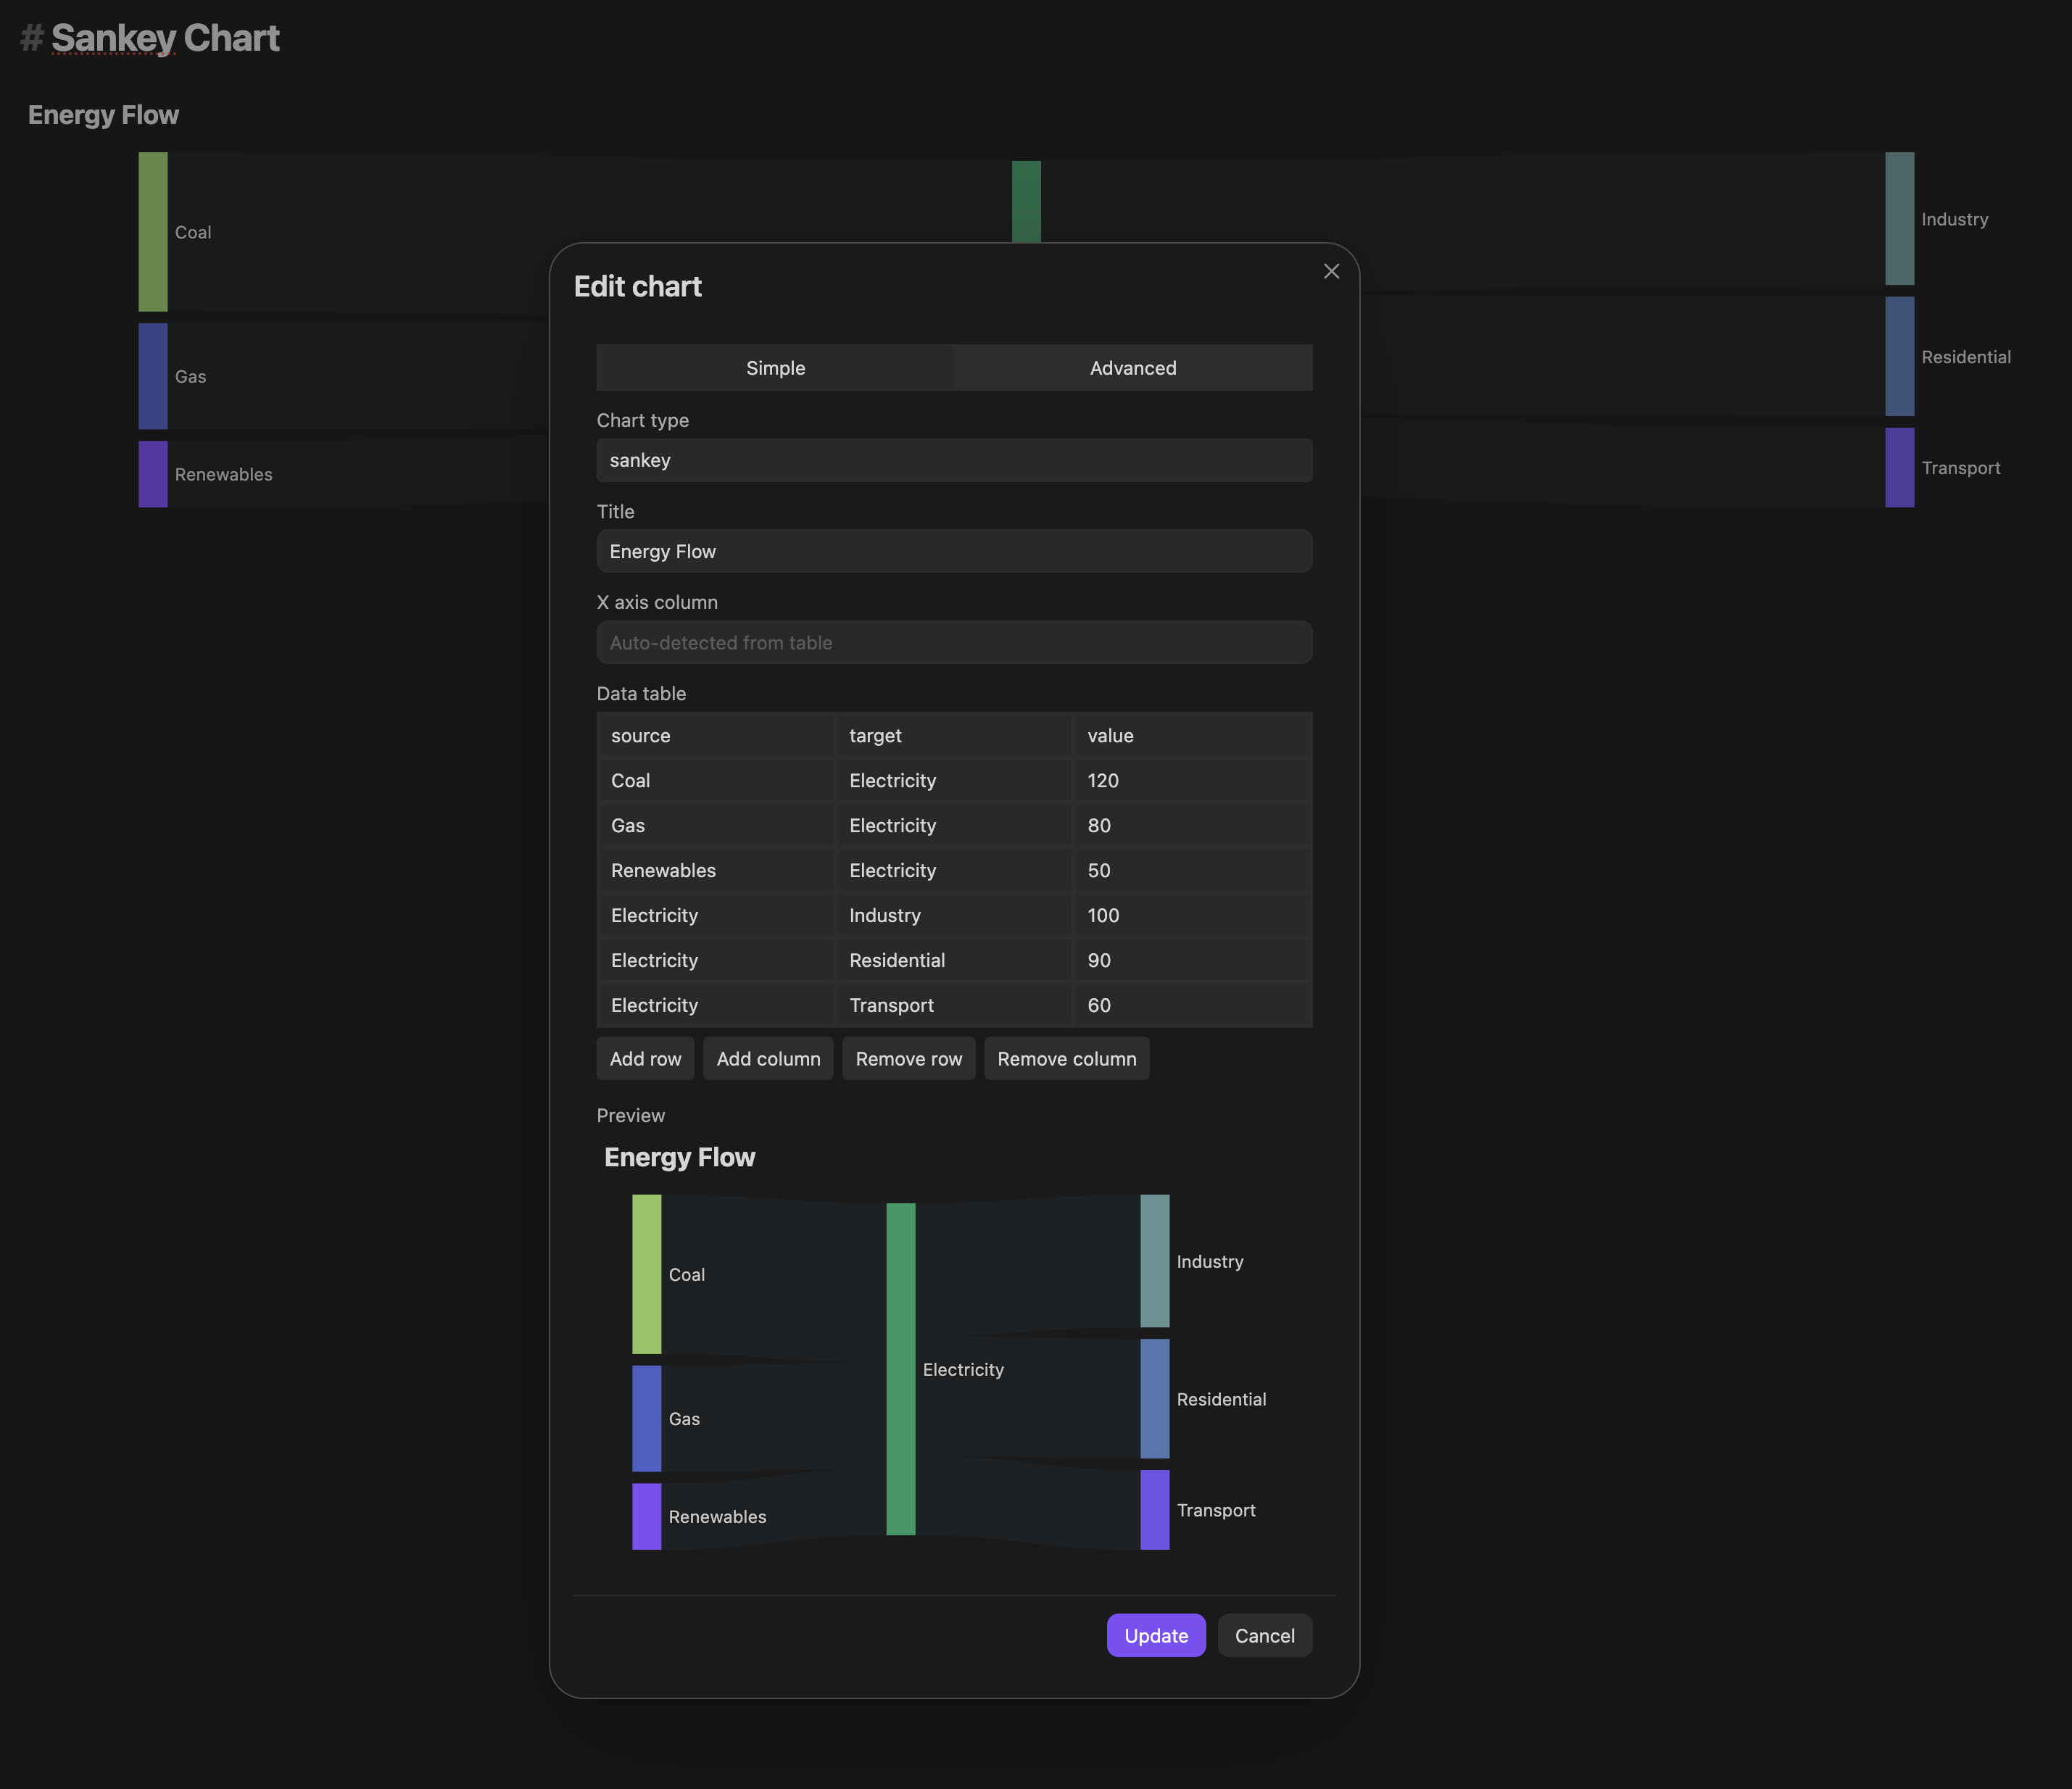
Chart types
| Type | Description |
|---|---|
bar | Vertical bar chart; one bar series per Y-axis column |
line | Line chart; one line per Y-axis column |
pie | Pie chart; one column for slice labels, one for values |
scatter | Scatter plot; X column provides X values, first Y column provides Y values |
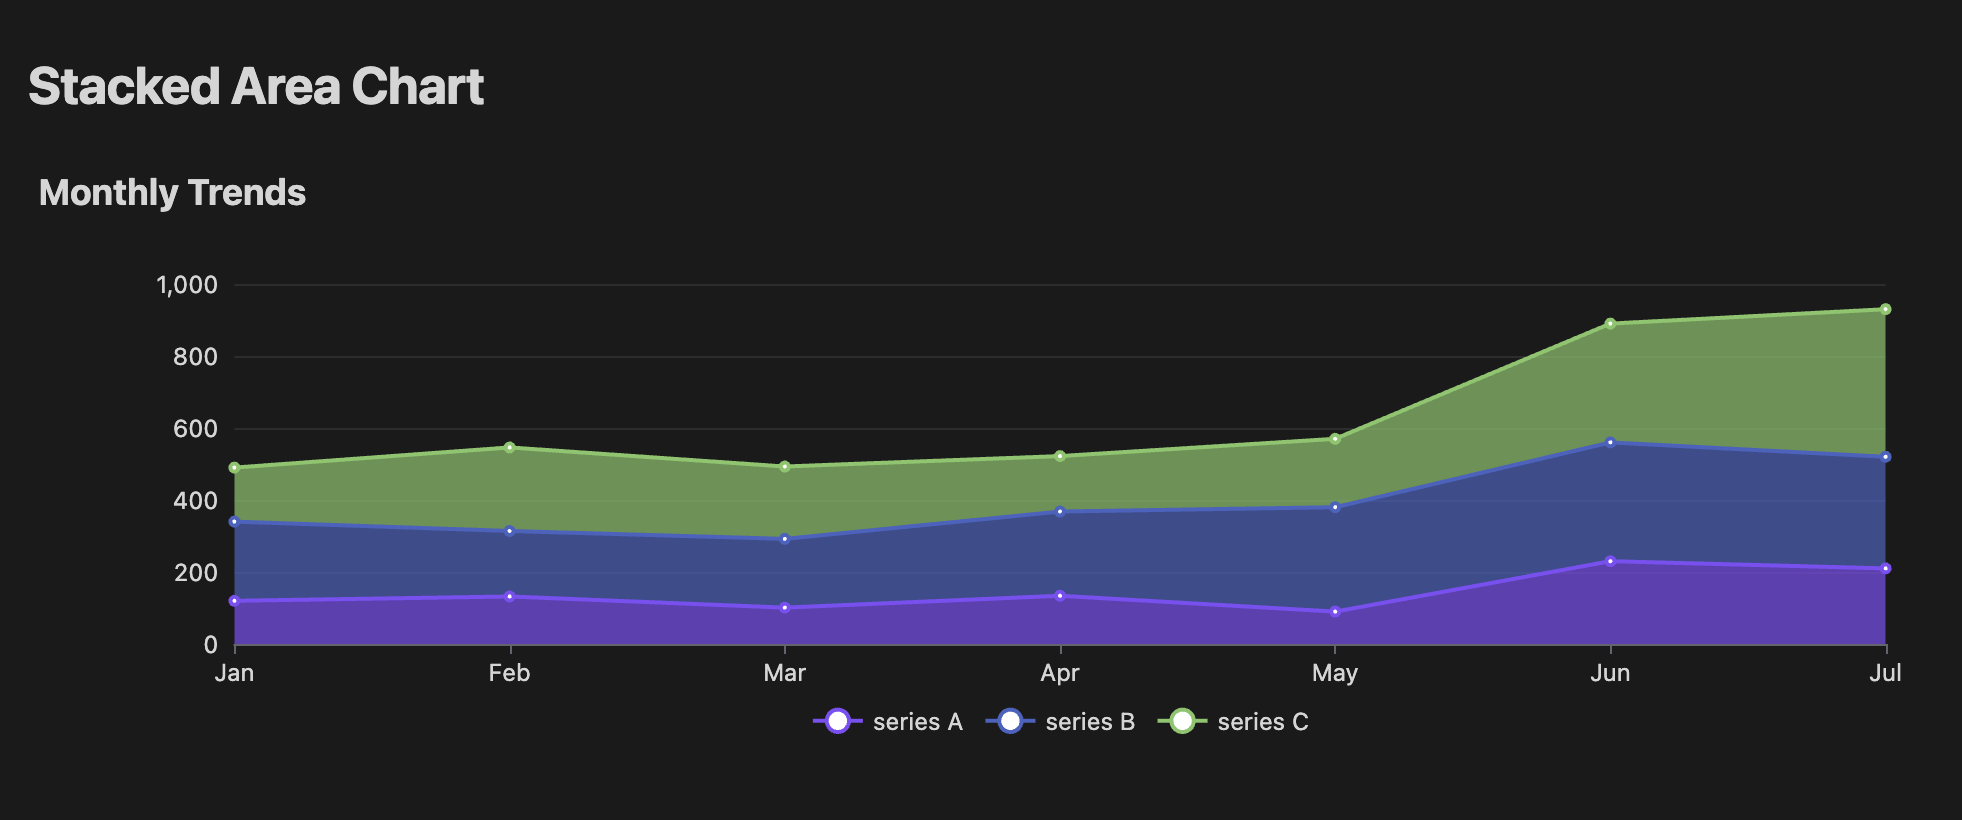
area | Stacked area chart; one filled series per Y-axis column |
funnel | Funnel chart; stage names and values |
heatmap | Heatmap; X category, Y category, numeric value — colour scale auto-computed |
sankey | Sankey flow diagram; source node, target node, flow value — nodes derived automatically |
The data format
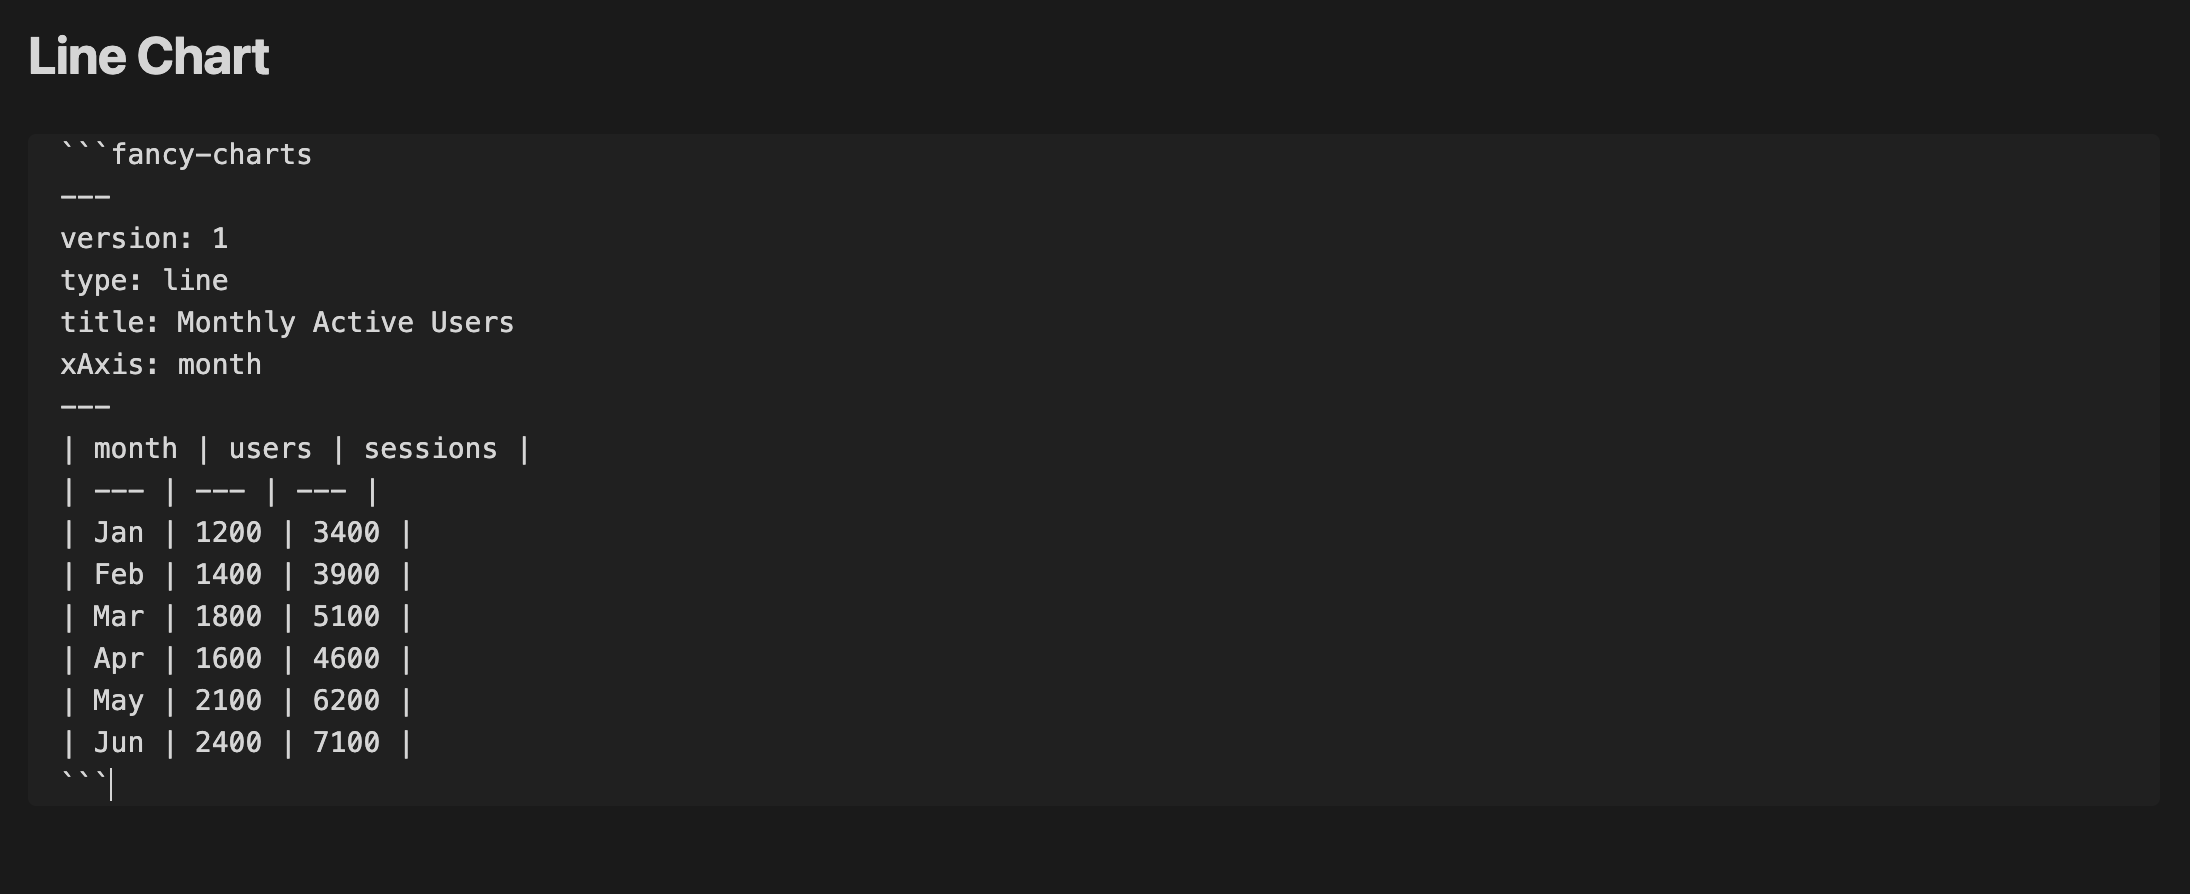
Charts are stored as a fenced fancy-charts code block in two modes:
Simple mode — a YAML config followed by a Markdown table:
```fancy-charts
---
type: bar
title: Quarterly Revenue
xAxis: quarter
yAxis:
  - revenue
  - costs
---
| quarter | revenue | costs |
| --- | --- | --- |
| Q1 | 120 | 80 |
| Q2 | 200 | 110 |
| Q3 | 150 | 90 |
| Q4 | 180 | 100 |
```
Advanced mode — a raw ECharts option object for full control:
```fancy-charts
echarts:
  xAxis:
    type: category
    data: [Q1, Q2, Q3, Q4]
  yAxis:
    type: value
  series:
    - type: bar
      data: [120, 200, 150, 180]
      name: Revenue
```
The full schema is documented in docs/schema.md.
Because the data is a standard Markdown table, a chart block is still readable — as a table, without the interactive chart — in any Markdown viewer, even without the plugin.
Generate charts with AI
If you use an agentic AI coding tool — Claude Code, Kiro, Codex, Pi, or any of the 75+ supported agents — you can install the Fancy Charts skill and ask it to generate chart blocks for you directly in your vault.
npx skills add robertoallende/fancy-charts
Once installed, your AI assistant knows the full block schema: chart types, config keys, table format, axis mapping, and advanced ECharts passthrough. You can prompt it naturally:
- "Create a bar chart showing monthly revenue and costs for Q1–Q4"
- "Generate a sankey diagram showing traffic flow between pages on my site"
- "Add a heatmap of activity by day and hour using this data table"
The AI writes a valid fancy-charts block directly into your note, ready to render with the plugin.
Feature Requests and Issues
If there's a gap you'd like prioritized, open an issue — this roadmap takes real usage and feedback into account.
License
MIT — Copyright (c) 2026 Astuten.io Ltd


For plugin developers
Search results and similarity scores are powered by semantic analysis of your plugin's README. If your plugin isn't appearing for searches you'd expect, try updating your README to clearly describe your plugin's purpose, features, and use cases.