Mandala Chart
approvedby Gurio
Interactive 9×9 Mandala Chart for structured goal planning — inspired by Shohei Ohtani's method. Supports markdown, 5 languages, and print export. - This plugin has not been manually reviewed by Obsidian staff.
Mandala Chart for Obsidian
An interactive Mandala Chart plugin for Obsidian — the 9×9 goal-planning framework popularized by baseball star Shohei Ohtani.
Languages / 言語: 🇯🇵 日本語 · 🇺🇸 English · 🇨🇳 中文 · 🇰🇷 한국어 · 🇪🇸 Español
(Auto-detected from your Obsidian language setting)
What is a Mandala Chart?
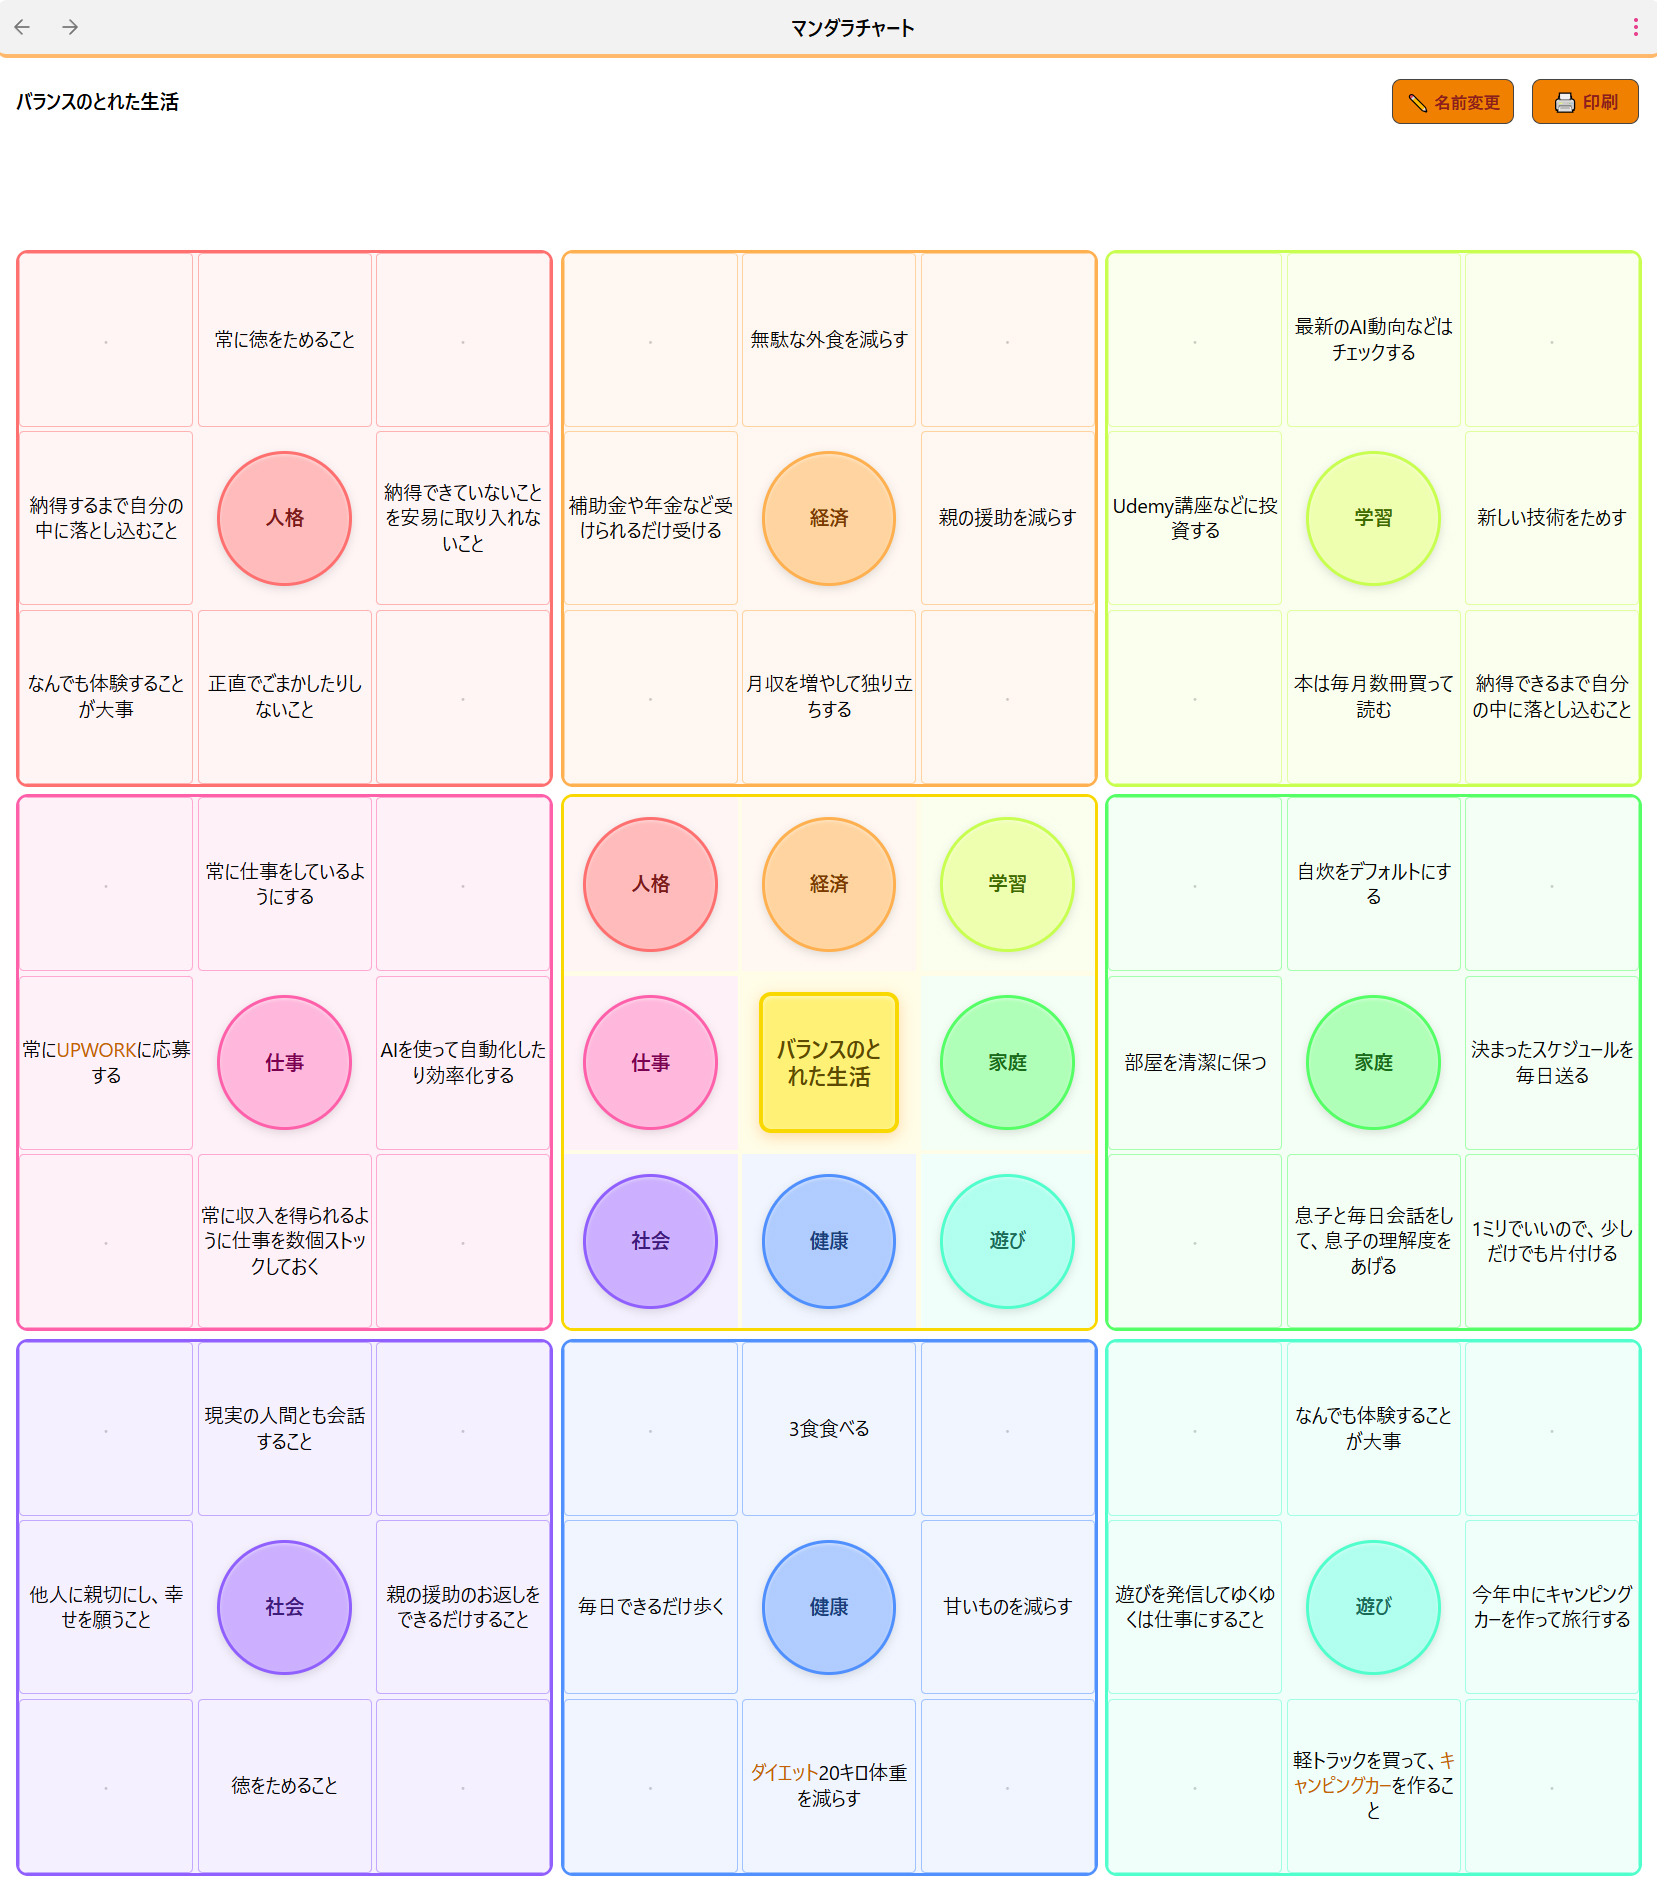
A Mandala Chart is a 9×9 grid used for structured goal planning. You place your main goal in the center, surround it with 8 key themes, and then expand each theme into 8 supporting ideas — giving you 64 action items at a glance.
Screenshots
Overview — 9×9 全体表示
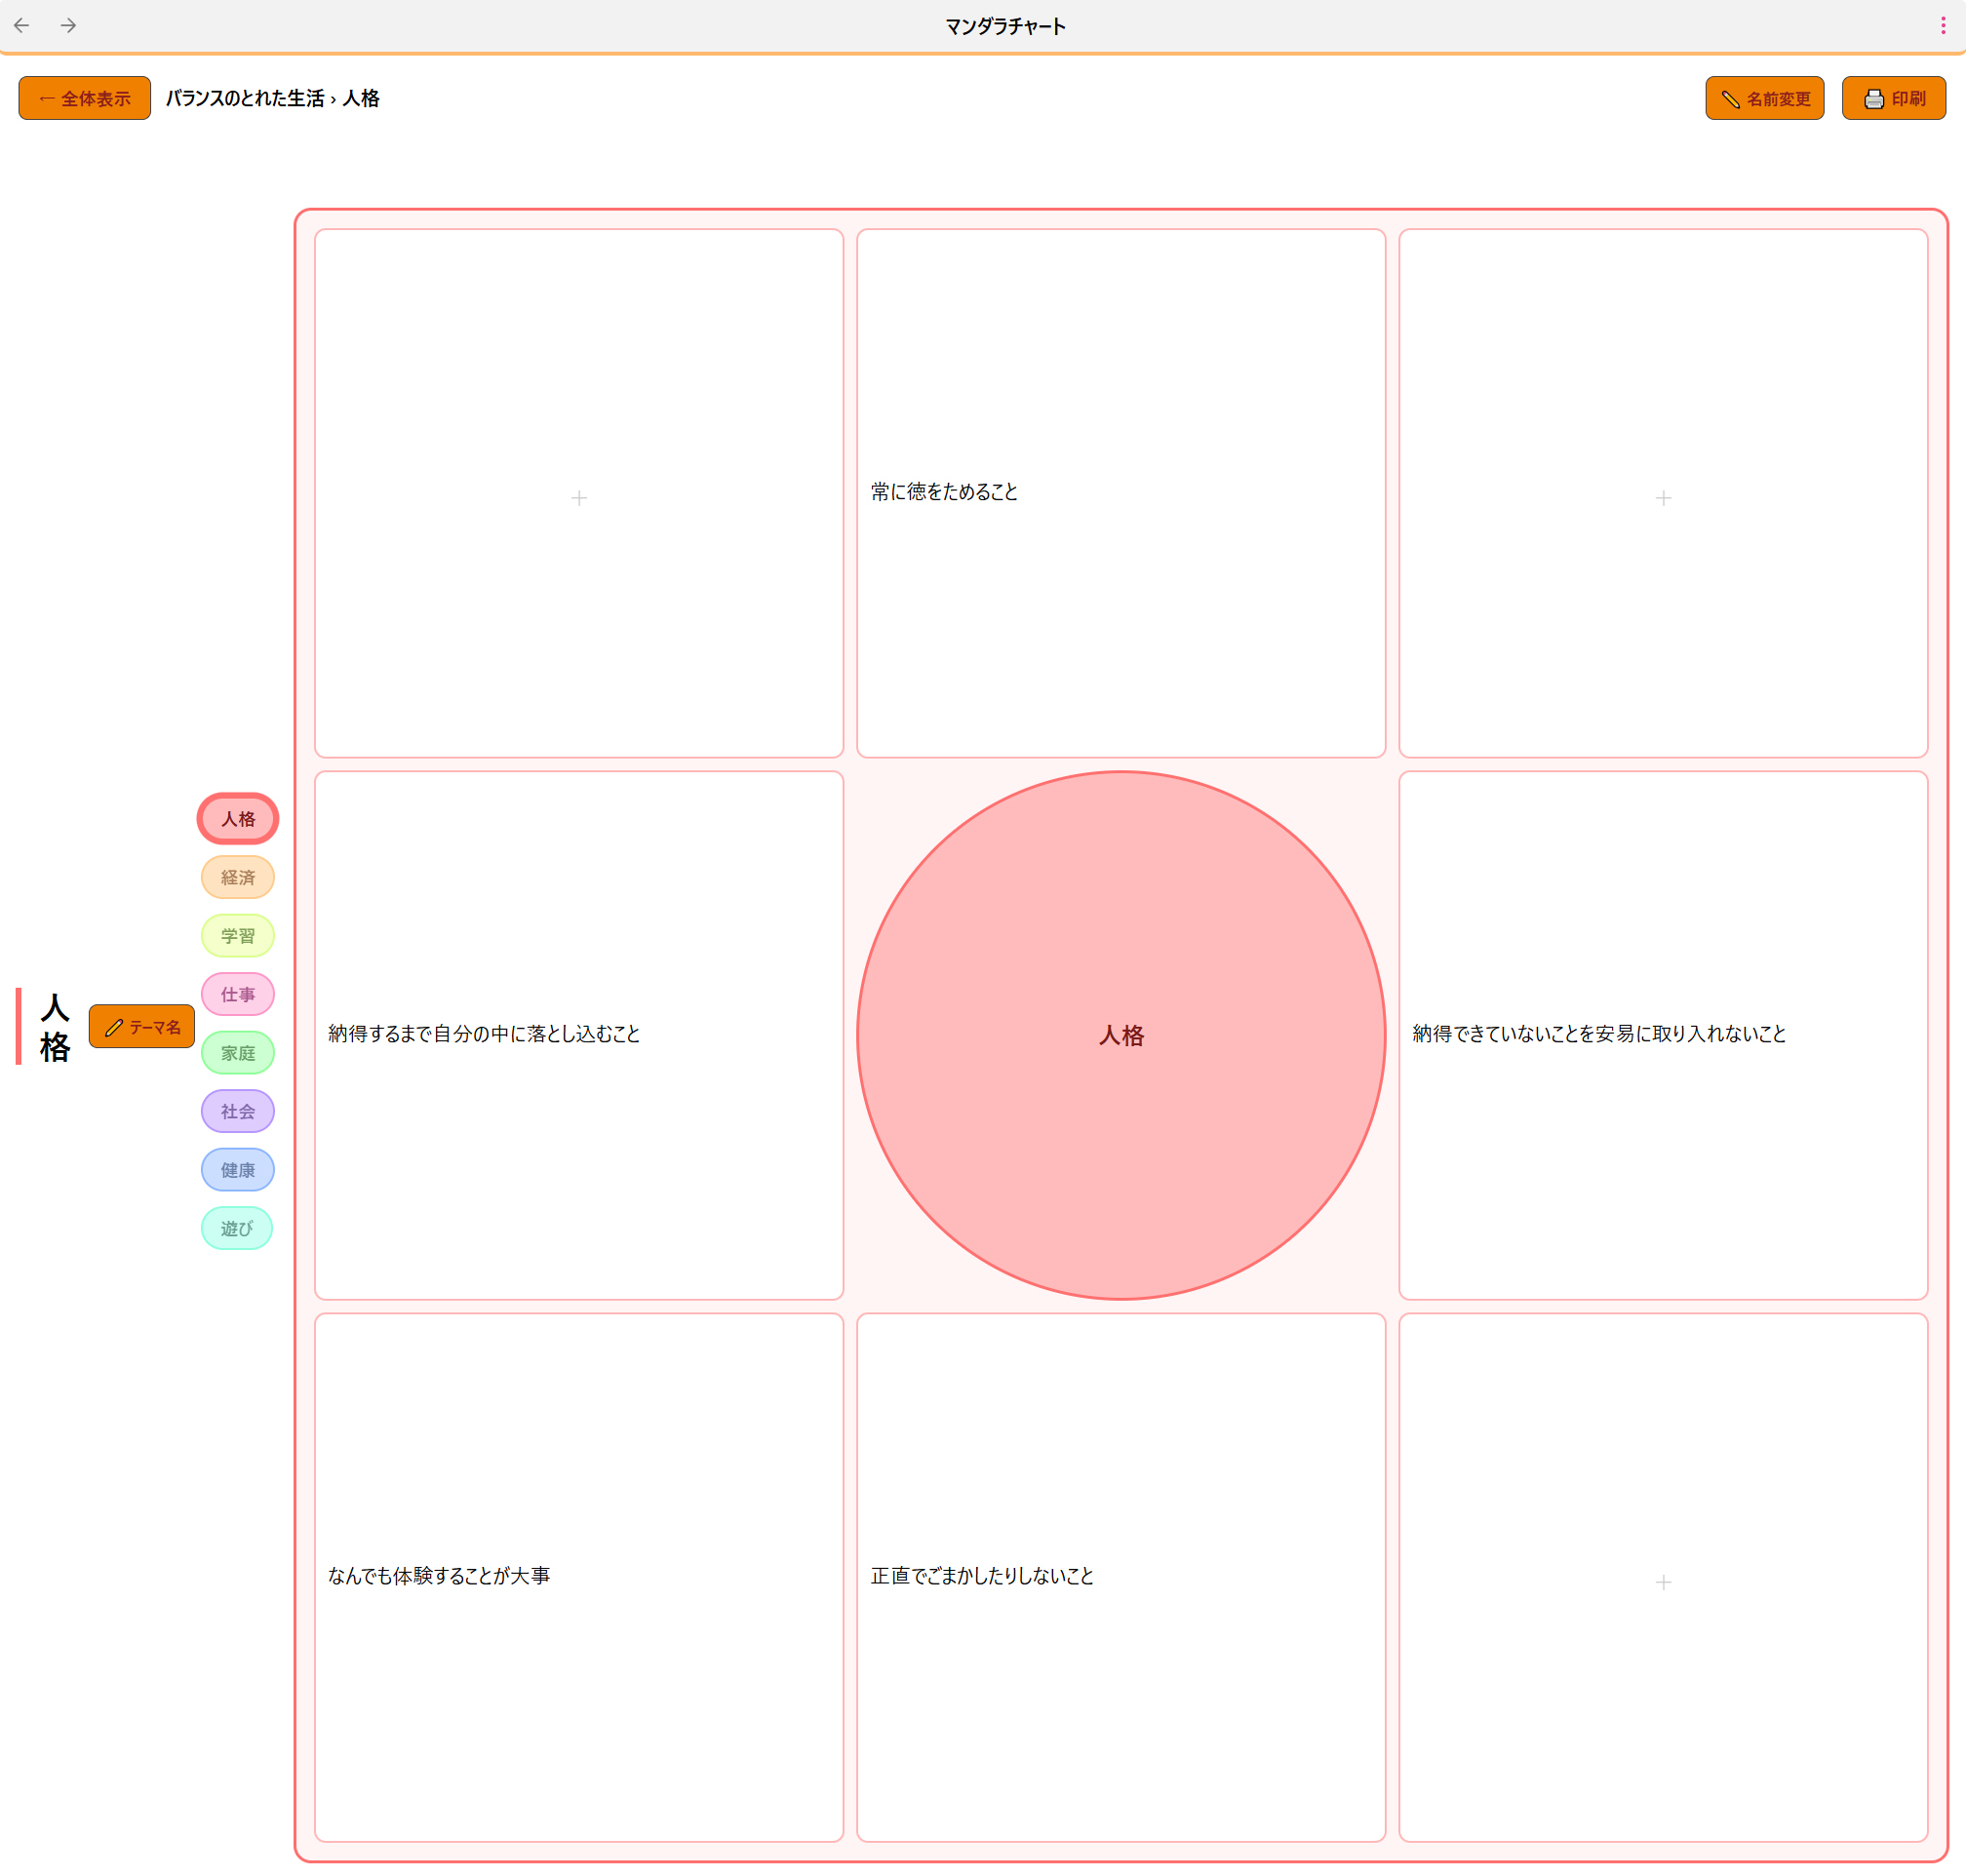
Focus Mode — テーマフォーカスモード
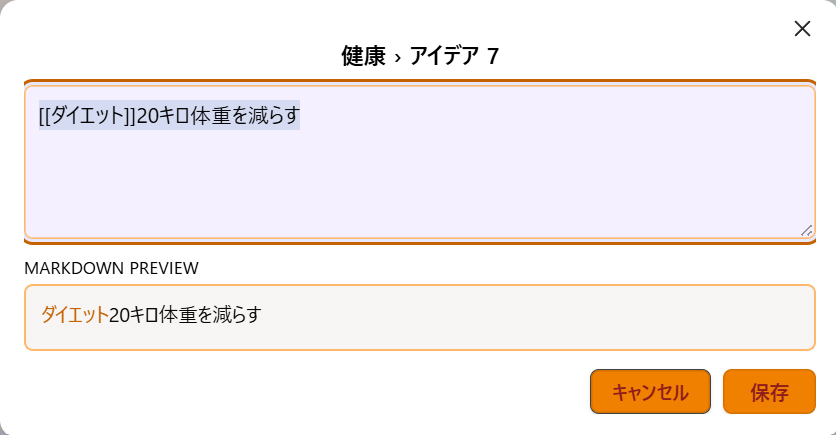
Edit Dialog — Markdown ライブプレビュー付き編集
Features
- 🎯 Interactive 9×9 grid — click any cell to edit inline
- 🔍 Two view modes — full overview and focus mode for each theme
- 🌈 Rainbow pastel colors — 8 themes colored clockwise in rainbow order
- ⭕ Circle design — all theme labels rendered as circles
- ✍️ Markdown support — use
#tags,[[links]],**bold**in any cell - ⊞ Open full view — transfer any embedded chart to the full-screen tab with one click
- 🖨 Print-ready — exports a clean A4 landscape page
- 🌐 5 languages — Japanese, English, Chinese, Korean, Spanish
- 📌 Ribbon icon — one-click access from the left sidebar
- 📝 Code block embed — embed charts directly in any note
- 💾 Auto-save — changes saved instantly
Installation
Community Plugin (Recommended)
- Open Obsidian → Settings → Community Plugins
- Disable Safe Mode if needed
- Click Browse and search for "Mandala Chart"
- Click Install, then Enable
Manual Installation
- Download the latest release
- Extract to your vault's
.obsidian/plugins/mandala-chart/folder - Enable the plugin in Settings → Community Plugins
BRAT (Beta)
https://github.com/gurio318/obsidian-mandala-chart
Usage
Method 1: Ribbon Icon
Click the ⊞ grid icon in the left sidebar to open a dedicated Mandala Chart tab. Your data is saved automatically between sessions.
Method 2: Embed in a Note
Use the command palette (Ctrl/Cmd + P) → "Insert Mandala Chart into note", or type the code block manually:
```mandala
{
  "center": "My Main Goal",
  "themes": [
    { "theme": "Theme 1", "items": ["", "", "", "", "", "", "", ""] },
    { "theme": "Theme 2", "items": ["", "", "", "", "", "", "", ""] },
    { "theme": "Theme 3", "items": ["", "", "", "", "", "", "", ""] },
    { "theme": "Theme 4", "items": ["", "", "", "", "", "", "", ""] },
    { "theme": "Theme 5", "items": ["", "", "", "", "", "", "", ""] },
    { "theme": "Theme 6", "items": ["", "", "", "", "", "", "", ""] },
    { "theme": "Theme 7", "items": ["", "", "", "", "", "", "", ""] },
    { "theme": "Theme 8", "items": ["", "", "", "", "", "", "", ""] }
  ]
}
```
Editing
- Click any circle in the center grid → opens a focused theme view
- Click any cell → opens an edit dialog (Ctrl/Cmd+Enter to save)
- Theme pills at the top → switch between themes in focus mode
- ← Overview button → return to the 9×9 view
Printing
Click 🖨 Print (top right) to open a print-optimized A4 landscape page with all 81 cells.
Color Design
The 8 themes follow a clockwise rainbow gradient around the center:
| Position | Color |
|---|---|
| NW ↖ | 🔴 Red |
| N ↑ | 🟠 Orange |
| NE ↗ | 🟡 Yellow-Green |
| E → | 🟢 Green |
| SE ↘ | 🩵 Teal |
| S ↓ | 🔵 Blue |
| SW ↙ | 🟣 Purple |
| W ← | 🩷 Pink |
The center main goal is highlighted in yellow ⭐
Data Format
Charts are stored as JSON in the mandala code block. You can edit the JSON directly or use the interactive UI.
{
  "center": "My Goal",
  "themes": [
    {
      "theme": "Theme Name",
      "items": ["idea1", "idea2", "idea3", "idea4", "idea5", "idea6", "idea7", "idea8"]
    }
  ]
}
Language Support
The UI language is automatically detected from your Obsidian locale setting. Supported languages:
| Language | Code |
|---|---|
| 日本語 | ja |
| English | en |
| 中文 (简体) | zh |
| 한국어 | ko |
| Español | es |
Contributing
Contributions, bug reports, and feature requests are welcome! Please open an issue or PR on GitHub.
License
MIT License — free to use, modify, and distribute.
Acknowledgements
Inspired by the Mandala Chart planning method, made famous by Shohei Ohtani's high school goal-setting chart.
For plugin developers
Search results and similarity scores are powered by semantic analysis of your plugin's README. If your plugin isn't appearing for searches you'd expect, try updating your README to clearly describe your plugin's purpose, features, and use cases.