Project Planner
approvedby Harrison Milburn
Forked from NicoKNL/tasks-map
Plan projects from your Markdown tasks with a dependency graph, Gantt chart with critical path, kanban board, and cost tracking. - This plugin has not been manually reviewed by Obsidian staff.
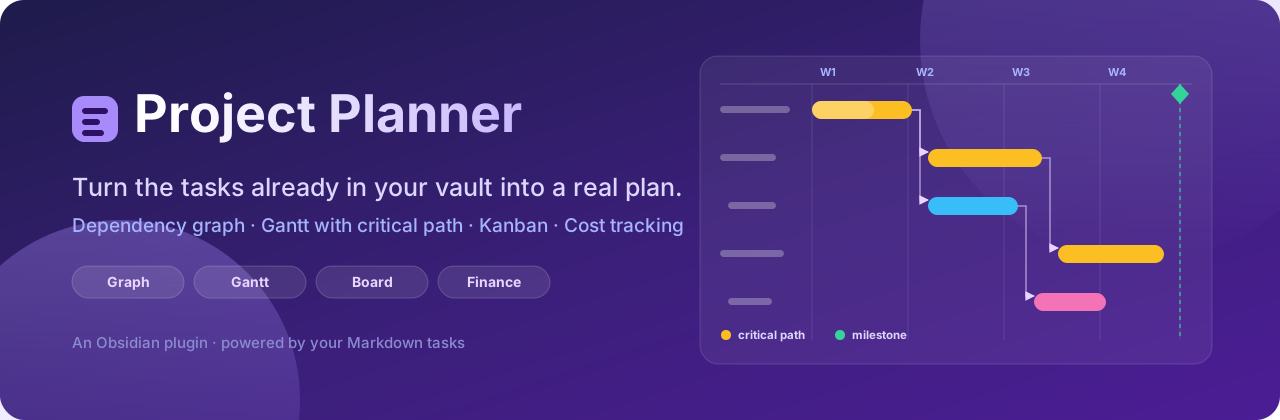





Project Planner turns the tasks you already have in your Obsidian vault into a plan you can actually run a project from — a dependency graph, a Gantt chart with a real critical path, a kanban board, and time-and-materials costing.
Nothing lives in a proprietary database. Every task, date, dependency, person and cost is read from and written back to plain Markdown, in the same Tasks and Dataview syntax you were already using. Delete the plugin and your notes still read exactly the same.
Contents
- Why this exists
- Requirements
- Installation
- Quick start
- How tasks are read
- The graph view
- The Gantt view
- The board view
- Finance
- Embedding a graph in a note
- Companion notes
- Undo
- Metadata reference
- Commands
- Settings
- Relationship to Tasks Map
- Development
- License
Why this exists
Most task plugins are good at capture and weak at planning. They will tell you what is due on Thursday. They will not tell you which of the eleven things due on Thursday is the one that, if it slips, moves your delivery date.
Project Planner is built around dependencies rather than dates:
- Dependencies are the primary data. A task that is blocked knows what it is waiting on, and every view is a different way of reading the same graph.
- Every task gets a bar, dated or not. Undated tasks are placed by their dependencies rather than dropped, so a plan is useful before anybody has sat down to fill in dates.
- Suggestions are never silently written. Inferred dates are drawn dashed and stay out of your notes until you accept them.
- Nothing is invented. Shares that do not total 100% are reported, not scaled. People with no rate cost nothing and are listed as unpriced. Costs resting on guessed dates are counted separately from costs resting on real ones.
Requirements
| Plugin | Required? | Why |
|---|---|---|
| Dataview | Yes | Reads inline - [ ] checkbox tasks out of your vault. The views refuse to render without it. |
| Tasks | Optional | Adds Create task and Edit task to the node context menu, using the Tasks plugin's own modal. |
Obsidian 1.8.0 or newer. Works on desktop and mobile — no Node or Electron APIs are used.
Installation
From the community plugin browser
Settings → Community plugins → Browse, search for Project Planner, install and enable.
Manually
- Download
main.js,manifest.jsonandstyles.cssfrom the latest release. - Copy them into
<your-vault>/.obsidian/plugins/project-planner/. - Reload Obsidian, then enable Project Planner under Community plugins.
Quick start
Write two ordinary tasks in any note, and give one an ID the other can point at:
- [ ] Draw up the frame 🆔 frame 🛫 2026-03-02 📅 2026-03-06
- [ ] Weld the frame ⛔ frame 📅 2026-03-11
- [ ] Paint it ⛔ weld
- [ ] Ship it 🆔 ship ⛔ paint
Open the graph icon in the ribbon. You get four connected nodes. Open the Gantt icon and you get four bars — the two with dates drawn where you put them, the two without drawn dashed, placed the day after whatever blocks them.
Turn on Critical path and the chain that decides the finish date lights up.
How tasks are read
Two kinds of task, both first-class, both read into the same model.
Inline checkbox tasks
Any - [ ] line anywhere in your vault, read via Dataview.
- [ ] Fit the sensor loom 🆔 loom ⛔ frame 🛫 2026-03-02 📅 2026-03-06 #electrical 🔼
Statuses come from the checkbox itself: [ ] to do, [/] in progress,
[x] done, [-] cancelled.
Note tasks
A whole note becomes one task when its frontmatter is tagged task. Use these
when a task needs somewhere to put detail.
---
tags:
  - task
start: 2026-03-02
due: 2026-03-06
blockedBy: [frame]
progress: 40
---
Both syntaxes, everywhere
Dependencies and metadata can be written as Tasks-plugin emoji or as Dataview inline fields, and the two can be mixed freely across a vault. Project Planner reads whichever a line already uses and writes back in the same style, so it never reformats notes into a house style you did not choose.
- [ ] Emoji style  🆔 a1 ⛔ b2 📅 2026-03-06
- [ ] Dataview style [id:: a1] [dependsOn:: b2] [due:: 2026-03-06]
The graph view
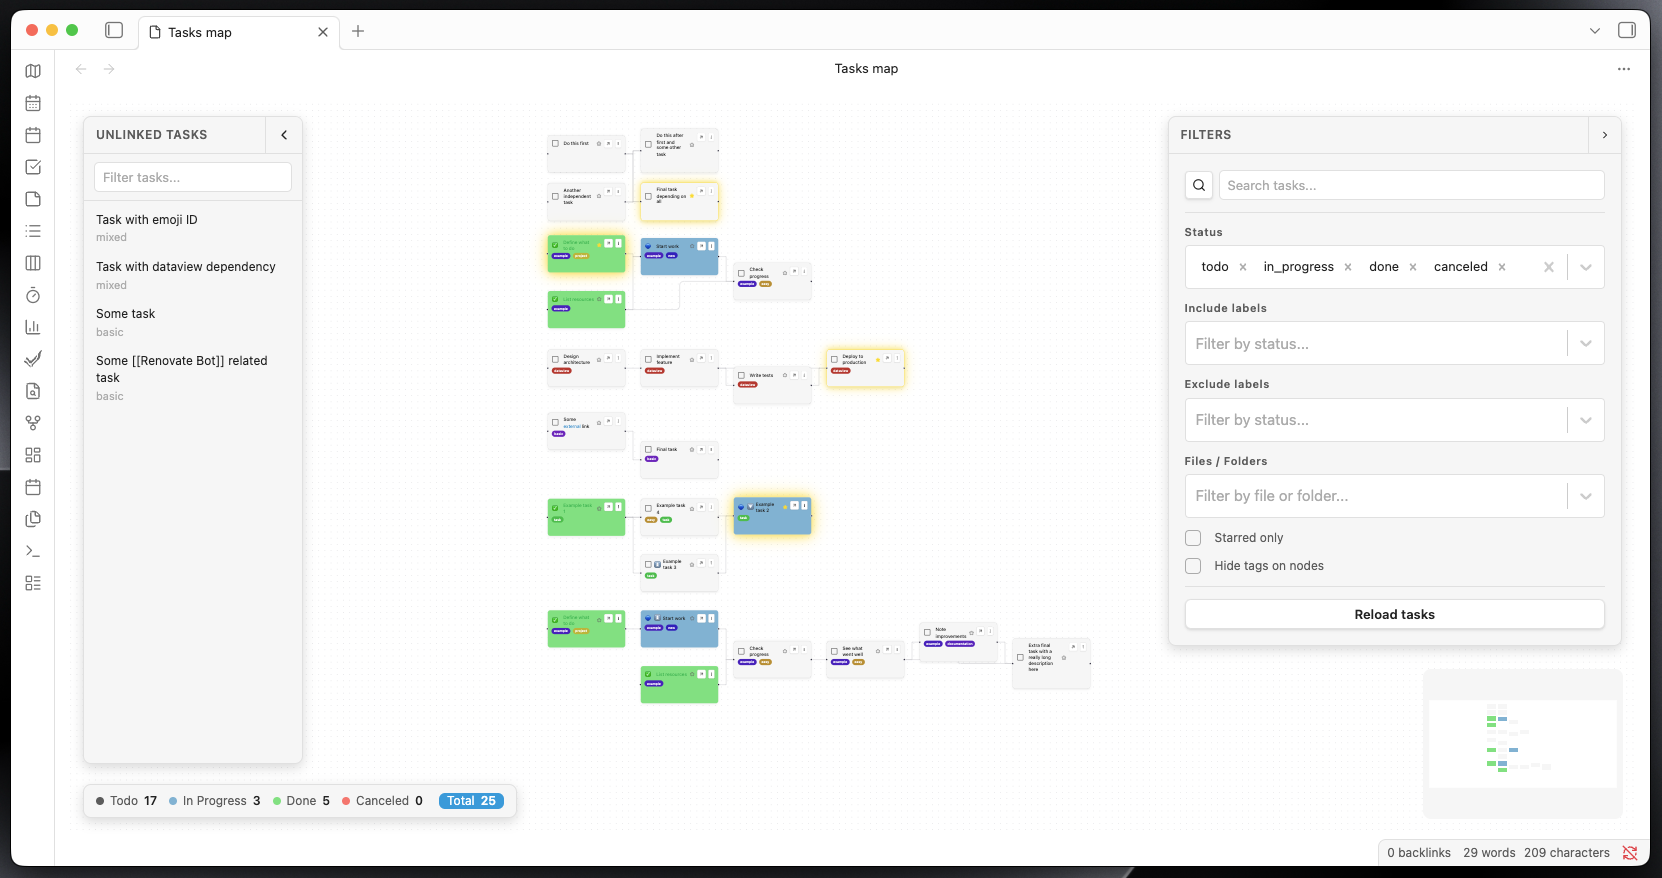
The dependency graph, on a pannable ReactFlow canvas with automatic dagre layout.
Nodes
Each task is a node showing its text, status, tags, priority and progress. Node controls:
| Control | Action |
|---|---|
| Status circle | Cycle the task's completion status |
| Star | Star or unstar the task (⭐) |
| Arrow | Open the note the task lives in |
| ⋮ | Context menu — create a child task, edit, set finance, delete |
| Tag chips | Click × to remove a tag, + Add tag to add one |
Wiki-links in task text render as real links and open the note they point at.
Edges
Drag from a node handle to another node to create a dependency; the ⛔/🆔
metadata is written into both notes. Click an edge and press Delete to remove
it, which strips the reference from the vault.
Chain healing: deleting a task in the middle of A → B → C hands B's
blockers to whatever was waiting on B, so A → C survives rather than the
chain quietly falling apart.
Per-edge styling: right-click an edge to override its line style individually, on top of the global Bezier / Straight / SmoothStep setting.
Critical path
Toggle Critical path to compute float across the whole plan — the gap between when each task finishes and the latest it could finish without moving the delivery date. Tasks with zero float are the critical path and are highlighted in both the graph and the Gantt. This is the set worth arguing about when a deadline is at risk; everything else has room to move.
Search, filters and traversal
The right-hand filter panel carries:
| Filter | Description |
|---|---|
| Search | By task text, ID or tag, with a live suggestion list (↑/↓/Enter/Escape) |
| Show dependencies / dependents | Pull the upstream and/or downstream chain of a search hit into view |
| Status | Multi-select — to do, in progress, done, cancelled |
| Include labels | Show only tasks carrying at least one selected tag |
| Exclude labels | Hide tasks carrying any selected tag |
| Files / folders | Restrict to selected notes or folders |
| Only starred | Show only starred tasks |
Filter presets save any combination by name, restore it in one click, and can be inserted straight into a note as an embed block.
Unlinked tasks panel
Tasks with no dependencies in either direction are moved to a left-hand panel rather than scattered across the canvas as noise. Search it, then drag any task onto the canvas to work with it. Connect it to something and it stays on the canvas for good.
Project groups
Tasks sharing a project are drawn inside a labelled group container, so a large vault reads as a handful of projects rather than one undifferentiated cloud.
The Gantt view
The same tasks on a timeline.
Every task gets a bar
A chart that only drew dated tasks would be nearly empty in a real vault, so every task is placed:
| The task has | The bar is |
|---|---|
Start (🛫, or ⏳ as fallback) and due (📅) | Drawn between them |
| Start only | One day long |
| Due only | Drawn from when its blockers finish up to the deadline — the window available |
| Neither | Starts the day after its last blocker finishes, lasts one day |
Because inference walks the dependency graph, a chain of undated tasks spreads out day by day in the order the graph says they must happen.
Suggested dates stay suggestions
Inferred bars are drawn as dashed outlines and nothing is written to your notes while they stay that way. Turn a proposal into a real date by dragging or resizing the bar, or use Apply suggested dates to write every dashed bar at once and get a count of what changed.
Editing
| Action | Result |
|---|---|
| Drag a bar sideways | Moves start and due together, keeping the length |
| Drag either edge | Changes that date alone |
| Click a task name | Selects the row and lights up its whole dependency chain |
| Drag the grip | Reorders rows; the order is saved |
| + on a row | Writes a new task directly below it, in the same note |
| Link on a row | Starts a dependency — click the task it should block |
Dragging snaps to whole days and a bar can never be shorter than one day.
Scheduling controls
- Working days — measure durations in working days and keep bars off weekends. The finance view follows the same setting, so money and schedule can never disagree.
- Sort by date — a mode, not a one-off shuffle: rows are drawn flat and earliest first while it is on, and your manual order and nesting come back untouched when you turn it off.
- Group by — tag, status, note or project.
- Collapse — fold a parent's children away; parents roll their children's span up into one bar.
- Zoom — days, weeks or months, with a Today button.
Milestones
Named days marked across the whole chart — "Design freeze", "Release 1.0" — drawn as a diamond in their own band with a dashed line down the timeline. Milestones are not tasks: no note, no duration, no dependencies, and nothing is ever written to your vault. Past milestones draw grey, today's orange, future ones purple. The timeline always stretches far enough to reach them.
Schedule warnings
Three ways a plan quietly goes wrong, flagged on the rows and counted under the chart:
| Warning | Meaning |
|---|---|
| Overdue | Finished on paper before today, and not marked done |
| Stalled | Should have started, and has not been touched |
| Backwards dependency | A blocker finishes after the work waiting on it |
Only dates you actually wrote are judged — flagging the chart's own guesses would be noise.
PNG export
Export the chart as a picture for a report or a slide. This is deliberately not a screenshot: it is a separate drawing of the same plan, laid out for paper. The whole timeline is fitted to the page width so nothing runs off the edge; it uses four print-safe colours; it drops weekend bands, day ticks and dependency arrows, which are the first things to become noise at page size; and it makes the parts that carry meaning bigger — title, span, group headings, milestone names, and a legend listing only what the chart actually uses. Today is marked only when today falls inside the plan.
The board view
Where the Gantt answers when, the board answers what state is this in — and dragging a card is what changes the answer.
| Group by | Columns | Dragging writes |
|---|---|---|
| Status | To do, In progress, Done, Cancelled | The checkbox |
| Due date | Late, Today, Tomorrow, Rest of this week, Next week, Later, No date | The 📅 due date |
| Person | One per name in [people:: …], plus Unassigned | The task's people |
| Tag | One per tag in use, plus No tag | The task's tags |
| Project | One per project | read only |
| Priority | 🔺 ⏫ 🔼 🔽 ⏬, plus No priority | read only |
| Note | One per note holding tasks | read only |
Dropping a card into a date column writes a real due date, so the card stays where you put it. Dropping one into a person's column makes it theirs alone; dropping it into Unassigned removes the people entirely. Read-only groupings show a padlock and refuse cards from other columns, but cards can still be reordered within them.
Card order is one list for the whole board, so a card dragged to another column keeps the position you dropped it in, and changing the grouping does not throw your arrangement away. Columns can be folded away, remembered per grouping. The + in a column header adds a task already carrying whatever that column stands for.
Finance
Time-and-materials planning, off by default — enable it under Settings → Project Planner → Finance.
A task consumes hours; those hours are worked by named people in some proportion; each person sits at a grade with a chargeout rate; and materials sit on top.
The rates note
Rates live in a note you own, not in plugin settings, so you can link to them
and keep them in version control. Default path Finance/People and rates.md.
| Grade      | Rate |
| ---------- | ---- |
| Principal  | 145  |
| Senior     | 110  |

| Person      | Grade     | Rate |
| ----------- | --------- | ---- |
| Alice Smith | Principal |      |
| Cara Diaz   | Senior    | 130  |
Tables are found by their column headers, not the headings above them, so
you can retitle, reorder and write whatever prose you like around them. A
person's own Rate overrides their grade's. Rows that cannot be read are
dropped and reported with their line number.
Putting finance on a task
- [ ] Fit the loom [hoursPerDay:: 6] [people:: Alice Smith 60%, Bob Jones 40%] [costs:: Loom kit 240, Travel 85]
| Field | Meaning |
|---|---|
hours | Explicit total hours — wins over everything |
hoursPerDay | Per-task override of the global default |
people | Who is on it, and their share |
costs | Materials and expenses |
Synonyms are accepted (totalHours/estimatedHours → hours,
allocations/who → people, expenses/materials → costs), and shares
may be written 60%, 60 or 0.6. The canonical spelling is written back.
How the cost is worked out
Hours come from an explicit total if there is one, otherwise from the length of
the task's bar × its hours-per-day. Rates resolve person-first, then grade.
Name matching is on meaning, not typing — Alice Smith, alice smith and
[[Alice Smith]] are one person.
What it refuses to fake:
- Someone with no rate costs nothing, and their hours are reported as unpriced rather than counted as free.
- Shares that do not total 100% are used exactly as written — scaling 60% + 30% up to 100% would hide a typo and inflate the plan.
- Cost resting on suggested dates is counted separately, and Include suggested dates leaves it out. A vault full of undated tasks will never quietly read as a large invented cost.
The dashboard
Headline tiles (total, labour, materials, hours, tasks priced, tasks with no finance), the labour/materials split, a breakdown by person, grade, project, tag, status or note, cost over time by week or month, the ten biggest costs each clickable through to the Gantt, and a Problems section listing everything that could not be worked out.
Embedding a graph in a note
A fenced project-planner block renders a fully interactive graph inline.
```project-planner
{
  "filter": {
    "onlyStarred": true,
    "selectedStatuses": ["todo", "in_progress"]
  },
  "config": {
    "height": 300,
    "showMinimap": false,
    "showFilterPanel": false
  }
}
```
An empty body ({}) shows the full graph with defaults.
Filter keys: selectedTags, excludedTags, selectedStatuses,
selectedFiles, searchQuery, traversalMode
(match/upstream/downstream/both), onlyStarred.
Config keys: height, showMinimap, showFilterPanel,
showPresetsPanel, showUnlinkedPanel, showStatusCounts.
Rather than writing these by hand, use Insert current filter as embedded graph from the command palette, or the insert button on a saved filter preset — both generate correct JSON.
Blocks tagged
```tasks-mapfrom before the rename are still rendered, so notes written against the old plugin keep working.
Companion notes
A checkbox line has nowhere to put detail. With companion notes enabled,
creating a task also creates a note for it and turns the task's text into a
link to that note. The note is deliberately not tagged task — that would
make it a second task in its own right and draw a duplicate node.
Create notes for existing tasks retrofits the whole vault at once, after asking for confirmation and telling you how many notes it will write.
Undo
One undo history, owned by the plugin and shared across every view — so the board can take back an edit the Gantt made, and vice versa. Row reorders, card moves, date drags, milestone changes, people reassignments and tag edits all step back through it.
Vault writes are optimistic: the UI updates immediately and rolls back if the write fails.
Metadata reference
Everything Project Planner reads and writes. Every emoji field has a Dataview
equivalent in [field:: value] or (field:: value) form.
| Concept | Emoji | Dataview | Note-task frontmatter |
|---|---|---|---|
| Task ID | 🆔 abc | [id:: abc] | — (the note is the identity) |
| Blocked by | ⛔ abc or ⛔ a,b,c | [dependsOn:: abc] | blockedBy: / dependsOn: |
| Due date | 📅 2026-03-06 | [due:: 2026-03-06] | due: |
| Start date | 🛫 2026-03-02 | [start:: 2026-03-02] | start: |
| Scheduled | ⏳ 2026-03-02 | [scheduled:: …] | scheduled: |
| Created / done / cancelled | ➕ ✅ ❌ | — | — |
| Priority | 🔺 ⏫ 🔼 🔽 ⏬ | — | — |
| Starred | ⭐ | — | — |
| Progress | — | [progress:: 40] or 40% | progress: |
| Parent | — | [parent:: abc] | parent: |
| Tags | #tag | — | tags: |
| Hours | — | [hours:: 12] | hours: |
| Hours per day | — | [hoursPerDay:: 6] | hoursPerDay: |
| People | — | [people:: Alice 60%, Bob 40%] | people: |
| Costs | — | [costs:: Loom kit 240] | costs: |
Out-of-range progress is clamped rather than rejected — someone who typed 120 meant "finished". Progress above zero displays as in-progress whatever the checkbox says, but 100% is never auto-promoted to done: finishing the work and declaring the task closed are different claims, and only the second is yours to make.
Commands
| Command | Description |
|---|---|
| Open graph view | The dependency graph |
| Open Gantt view | The timeline |
| Open board view | The kanban board |
| Open task finance | The finance dashboard (when finance is enabled) |
| Create the rates note | Creates and opens the rates note (when finance is enabled) |
| Create notes for existing tasks | Retrofit companion notes across the vault |
| Insert current filter as embedded graph | Write an embed block into a note |
Ribbon icons are provided for the graph, Gantt, board and — when enabled — finance views.
Settings
| Group | Settings |
|---|---|
| Display | Show priorities, show tags, show status counts |
| Layout | Direction (horizontal/vertical), edge style (Bezier/Straight/SmoothStep), SmoothStep corner radius |
| Tag appearance | Palette (Rainbow, Ocean, Forest, Sunset, Mono) plus per-tag colour pinning, with Reset all |
| Task relations | How dependencies are written: CSV, individual, or Dataview |
| Gantt | Working days, critical path, schedule warnings, row order and collapsed rows |
| Board | Group-by, card order, collapsed columns |
| Finance | Enable, rates note path, default hours per day, currency, include suggested dates |
| Companion notes | Enable, and the folder to write them to |
| Language | English, Nederlands, 简体中文 |
| Advanced | Debug visualisation overlays |
Relationship to Tasks Map
Project Planner began life as a fork of Tasks Map by Nico Klaassen, and it owes that project its foundation: the graph canvas, the dual inline/note task model, the Dataview integration and the filtering core all started there. Credit where it is due — that groundwork is what made the rest possible, and it remains MIT licensed with the original copyright notice intact.
It has since grown into a substantially different plugin. Tasks Map visualises tasks as a graph. Project Planner is a project-planning tool that happens to include that graph. Added since the fork:
- The Gantt view in its entirety — date inference from the dependency graph, dashed suggestions that stay out of your notes, drag-to-schedule, working-day scheduling, grouping and collapsing, date-order mode, milestones, schedule-risk warnings, and print-oriented PNG export.
- Critical path analysis — float computed across the whole plan, surfaced in both the graph and the Gantt.
- The kanban board — seven groupings, each writing back the thing its columns stand for.
- The finance system — rate books read from a note you own, per-task hours, people and materials, cost roll-ups by person, grade, project, tag, status and note, cost-over-time, and a problems report that refuses to invent numbers.
- Companion notes, with vault-wide retrofit.
- Chain healing on task deletion, so removing a task does not break the run of work through it.
- Plugin-wide shared undo across every view.
- Progress tracking, parent/child hierarchy, project grouping, per-edge style overrides and filter presets.
The name changed because "Tasks Map" no longer described it. This is a planner that reads your tasks, not a map of them.
Development
npm install
npm run dev
| Command | Purpose |
|---|---|
npm run dev | esbuild watch build |
npm run build | Typecheck + production bundle |
npm run build:deploy | Build, then copy into a local vault |
npm test | Jest |
npm run lint | ESLint over src/**/*.{ts,tsx} |
npm run lint:css | Stylelint |
npm run format | Prettier check |
src/lib/ is pure, framework-free logic — scheduling, critical path, finance,
costing, Gantt rows, filtering and graph traversal — and is where the unit
tests point. React components stay presentational.
Set a deploy target in .obsidian-plugin-dir or $OBSIDIAN_PLUGIN_DIR;
deploy.mjs copies main.js, manifest.json and styles.css and never
touches your vault's data.json.
Contributions are welcome — please open an issue or PR.
License
MIT.
Copyright © 2025 Nico Klaassen (original Tasks Map plugin) and © 2025–2026 Harrison Milburn (Project Planner). The original copyright notice is retained as the MIT License requires.
For plugin developers
Search results and similarity scores are powered by semantic analysis of your plugin's README. If your plugin isn't appearing for searches you'd expect, try updating your README to clearly describe your plugin's purpose, features, and use cases.