Terrain Graph
approvedby GUX
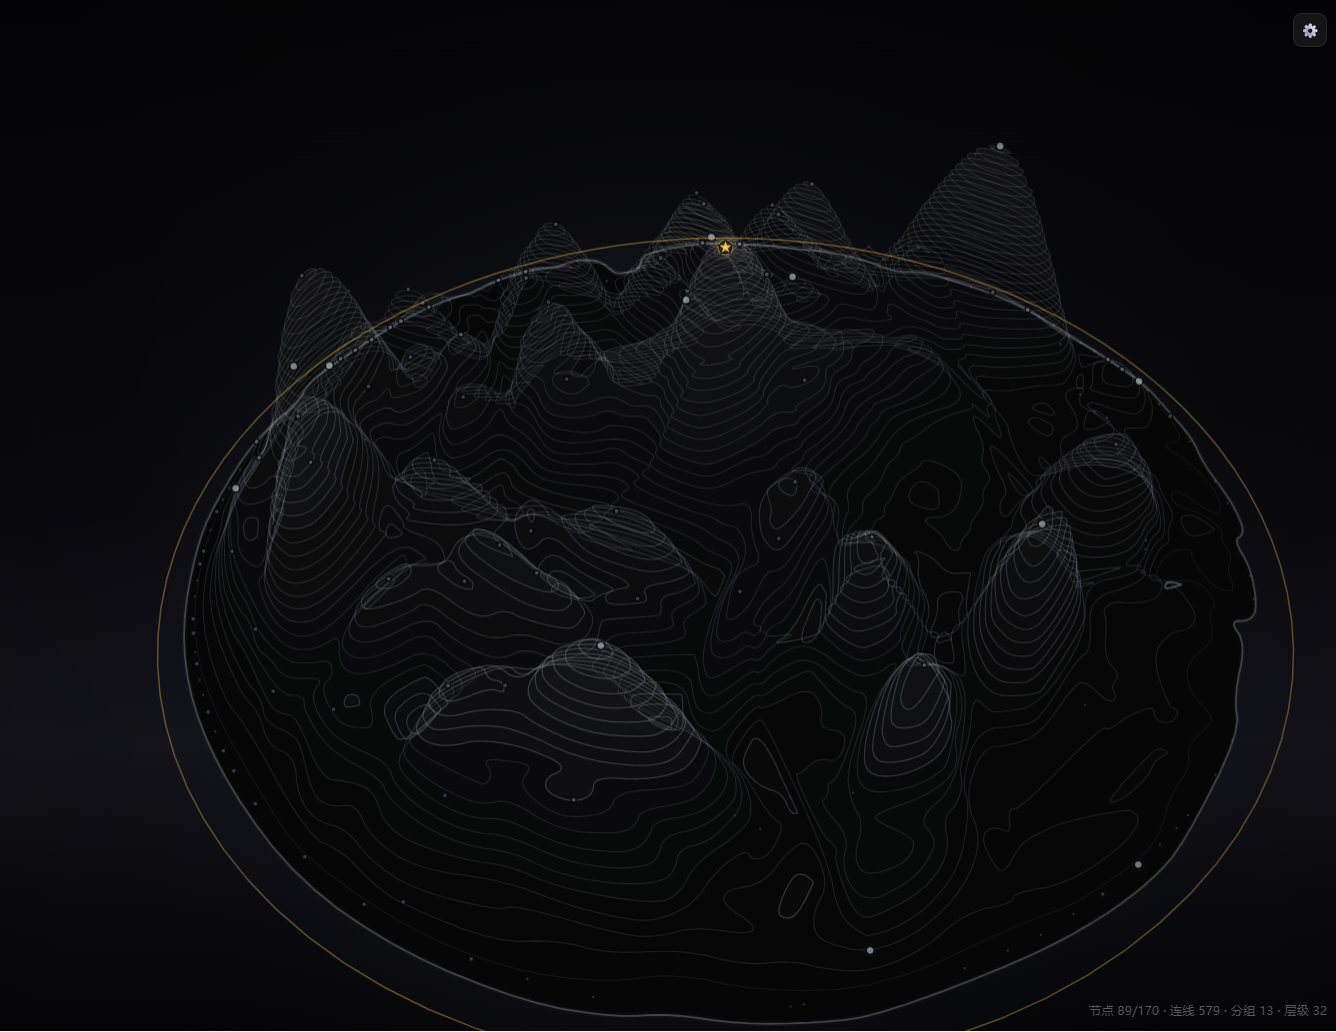
把关系图谱渲染成 3D 山峰等高线图:链接越多的文档海拔越高,联系紧密的文档聚成一座山,最高连接数的文档是主峰。 - This plugin has not been manually reviewed by Obsidian staff.
Terrain Graph 山峰图谱
Render your Obsidian link graph as a 3D tilted mountain contour map: the more links a note has, the higher its peak; tightly connected notes cluster into one mountain; the most-linked note is the main peak of the whole range.
Preview
Features
- Altitude = link-count level: link counts are log-normalized and quantized into N levels; equal link counts share the same altitude
- One mountain per community: label-propagation (LPA) community detection groups tightly linked notes into a single mountain, with valleys between ranges
- Layout follows the official graph view: mountain positions come from the same d3-force
simulation the built-in graph uses (forceX/Y, charge, link, collision), with parameters read from
your vault's
graph.json; the layout is stable across opens - Realistic terrain: weighted Gaussian upper-envelope height field + Everest-region DEM shaping + fBm/ridge-noise micro-terrain; contours extracted with Marching Squares, then Douglas-Peucker + Chaikin smoothing
- Filled surfaces with lighting: contour rings are filled, hillshade lighting, painter's algorithm depth sorting so near mountains occlude far ones
- Adaptive circular canvas: radius scales with node/edge count, edged with a thin gold ring
- 3D interactions: drag to rotate, scroll to zoom, double-click to reset, click to open a note, right-click to deselect
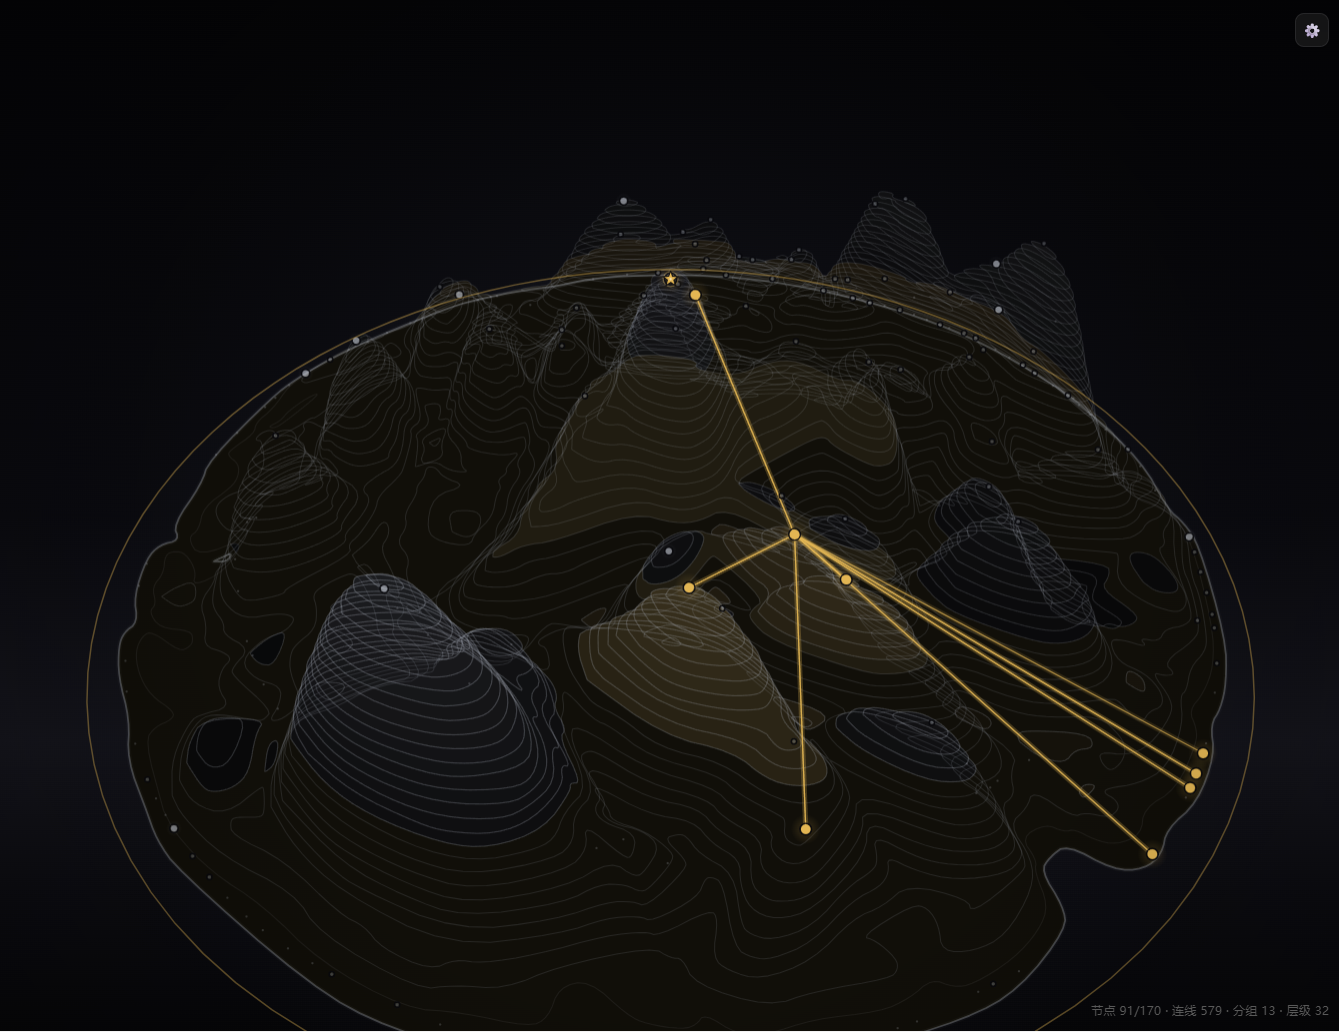
- Selection highlight: clicking a node lights up its direct neighbors in gold (optional)
- Main peak marker: the highest-degree note is marked with a star at the center
- Settings panel: official-graph-style, all settings auto-saved
Install
Manual
- Copy
manifest.json,main.js,styles.cssfromplugin/into.obsidian/plugins/terrain-graph/in your vault - Obsidian → Settings → Community plugins → enable Terrain Graph
- Open the view from the left sidebar icon, or run the command "Open terrain graph"
BRAT
Install BRAT and add this repository.
Usage & Settings
Click the gear button in the top-right of the view to open the settings panel:
| Setting | Description |
|---|---|
| Levels | Number of contour levels (altitude layers) |
| Mountain width | Horizontal width of each mountain (Gaussian bandwidth) |
| Min links | Notes below this degree are demoted in display |
| Ghost low-degree nodes | Keep low-degree notes as faint dots |
| Show attachments / orphans / unresolved | Which node types appear (mirrors the official graph) |
| Docs / Names | Show document markers and name labels |
| Highlight selection | Light up direct neighbors when a node is selected |
| Relayout / Reset | Re-run the force layout / restore defaults |
Interactions: drag to rotate, scroll to zoom, double-click to reset, click to pin a selection (gold 1-hop highlight), right-click to deselect, hover for a note card. The bottom-right corner shows the selected note and node/edge/group/level statistics.
Development
cd plugin
npm install
npm run build    # type-check + bundle main.js
npm run dev      # watch mode
main.js bundles d3-force, so there are no runtime dependencies to install separately.
Structure
terrain-graph/
├── plugin/              # Obsidian plugin
│   ├── manifest.json
│   ├── main.js          # build output
│   ├── styles.css
│   └── src/             # TypeScript source
│       ├── main.ts      # plugin entry, settings panel, view registration
│       ├── graph.ts     # graph building, community detection
│       ├── terrain.ts   # force layout, height field, contours
│       ├── render.ts    # 3D rendering, interactions
│       └── everest.ts   # Everest-region DEM data
├── docs/                # screenshots
├── LICENSE
└── README.md
Credits
- Layout engine d3-force (MIT)
- DEM data from SRTM (Everest region)
License
MIT
For plugin developers
Search results and similarity scores are powered by semantic analysis of your plugin's README. If your plugin isn't appearing for searches you'd expect, try updating your README to clearly describe your plugin's purpose, features, and use cases.