Token Usage
approvedby Björn-Olaf Lange
Real-time Claude Code token tracking, plus a rate-limit estimate that gets more precise the more you use it. NextGen sidebar with heatmap and calendar, HTML dashboard. No API key needed. - This plugin has not been manually reviewed by Obsidian staff.
Token Usage
Token Usage is an Obsidian plugin that tracks Claude Code token consumption from locally stored session files.
Instead of relying on API access or external dashboards, Token Usage reads Claude Code's local JSONL files and displays real-time token statistics directly inside Obsidian — broken down by type, time range, and model.
Full documentation & manual — installation, data sources & transparency, core concepts, settings reference, and an FAQ, all on one searchable page (English, German, French).
For power users: Token Usage tracking is machine-wide by default (see How It Works) — but the Vault / Project Breakdown splits that back down by working directory, so you can see exactly which client, project, or vault consumed how many tokens and when. Export it as a standalone Markdown report to hand to a client as a usage/billing reference.
Features
- Vault/project breakdown for power users — see exactly which vault or client project consumed how many tokens and when, exportable as a standalone Markdown report for client billing (see Vault / Project Breakdown)
- Live sidebar panel with token breakdown across five time ranges
- Separate display of all four token types: Input, Output, Cache Write (C.Write), Cache Read (C.Read)
- Rolling 5-hour session window matching Claude Code's internal rate-limit window
- Context sub-labels under each section title — shows scope at a glance ("Rolling window · counts toward rate limit", "Started yesterday · spans multiple days", "Calendar day · since midnight")
- Logarithmic scale for minibar widths — keeps all four token types visually proportional even across large magnitude differences
- Spike warning — amber badge when today's usage is ≥ 2× your personal recent average (window follows your Claude data retention setting)
- Collapsible sections — all five time-range sections fold individually, state persists across refreshes
- 7-day bar chart with model distribution — stacked by Haiku, Sonnet, Opus, Fable
- Rate limit tracking — session and weekly limit hits auto-detected from local JSONL files, with threshold estimates and 6-week billing chart in the dashboard
- HTML dashboard with 30-day charts, model donut, top sessions table, cache efficiency analysis, and rate limit history
- Markdown report export directly into your vault
- Daily archive — compact Markdown summaries written to your vault, so long-term trends survive Claude Code's own 30-day cleanup. Backfills automatically on first install and after any gap
- Adjustable Claude data retention — read and set
cleanupPeriodDaysdirectly from Settings, no manual JSON editing - Built-in Help panel with full glossary and cost reference, including "The three time views" and "Archive & long-term data" entries
- "← Back" button in the header returns from the glossary to the data view
- Language selection — English, German, French, and Italian (community translations welcome)
- Settings button (⚙) in the header — opens plugin settings with one click
- Command Palette integration for all major actions
- No API key required — reads local files only
- Local-first and privacy-friendly
- Machine-wide by design — reads from a single global location (
~/.claude/projects/), independent of which Obsidian vault is open. Numbers reflect all Claude Code usage on your machine, not just this vault (broken back down per vault/project — see above)
Why Token Usage?
As Claude Code usage grows, understanding where tokens actually go becomes important for both cost awareness and workflow optimization.
Most existing solutions require organization-level API access or live in separate dashboards outside your daily workflow.
Claude Code already stores detailed usage information locally in JSONL session files. Those files contain all token data, timestamps, session identifiers, and model information.
Token Usage brings those insights directly into Obsidian, where many users already manage their projects, notes, and knowledge base.
How It Works
Token Usage scans Claude Code session files stored at ~/.claude/projects/ and extracts token data from every recorded interaction.
Example JSONL entry:
{
  "input_tokens": 3,
  "cache_creation_input_tokens": 16926,
  "cache_read_input_tokens": 0,
  "output_tokens": 252
}
The plugin aggregates all four token fields across sessions and time ranges. All calculations run locally on your device.
A live file watcher detects new activity the moment Claude Code writes a response. A configurable fallback polling interval runs in parallel.
This directory is global, not per-vault. ~/.claude/projects/ lives in your user profile, outside any Obsidian vault, and contains one subfolder per working directory Claude Code has ever been run in. Token Usage reads all of them and aggregates the totals. This means:
- Switching between Obsidian vaults has no effect on the numbers — the plugin doesn't read anything from the vault itself, so the same totals show up no matter which vault is open.
- If you use Claude Code in more than one place on this machine (other vaults, plain code repositories, etc.), all of that usage is combined into one number by default. The Vault / Project Breakdown below splits that combined number back down per working directory, with no extra setup.
What is measured (and what isn't)
Because the plugin reads what Claude Code writes to disk, it covers every way you run Claude Code: in a terminal, inside Obsidian, in an editor such as VS Code, and the agent mode built into the Claude desktop app (which runs Claude Code embedded and writes the same session format to its own location — Token Usage reads that too, since v1.8).
It cannot show ordinary chat — the conversations you have in the Claude desktop app or on claude.ai. Those never write token counts to your machine. The only usage signal exposed there is a rounded percentage of your current limit, not the per-request token counts this plugin is built on.
This matters for one number in particular: the rate limit estimates in the dashboard are derived from how many tokens were counted when a limit was actually hit. Chat usage draws on the same plan limit but leaves no local trace, so if you use chat alongside Claude Code, the real limit sits somewhat higher than the estimate shown.
Vault / Project Breakdown
This is the power-user feature: see exactly which vault or client project consumed how many tokens, and when — exportable for billing.
Every JSONL entry Claude Code writes already carries a cwd field — the exact working directory the request ran in. Token Usage uses that to break the machine-wide totals (see above) back down by vault, with no extra setup.
Two levels, shown in different places on purpose:
- Vault (root) — the working directory a session actually started in. This is what the Dashboard and sidebar show: one row per vault, no further breakdown. A single session's
cwdcan drift during the session itself (e.g. a tool call briefly working inside a subfolder) — Token Usage tracks the session's start directory as the stable vault anchor, so that drift never splits one vault's usage into multiple rows or misrepresents how many days you actually worked in it. - Project (sub-folder) — the finer-grained, individual
cwdvalues seen within a vault. This level is deliberately not shown in the Dashboard (it reflects incidentalcwddrift, not real per-topic effort, and gets noisy fast) — it only appears in theVault_Token_Usage_Projects.mdexport's "Project Detail" section, for power users who want to dig further (e.g. pull it into Excel).
Display name: just the last folder of the path (e.g. Thats_Me), not the full path — kept deliberately simple. If you use more than one Claude Code working directory sharing the same folder name, their usage is combined under that shared name.
Where to see it:
- Dashboard → Projects tab — an overview table (vault, total tokens, % of the whole, active days, first/last active date) plus a day-by-vault detail table that follows the header's period dropdown, same as the rest of the dashboard. Both tables are vault-level only. Click any column header to sort by it (click again to reverse). See Dashboard below.
Vault_Token_Usage_Projects.mdexport — a standalone Markdown report with the same vault-level overview and daily-detail tables, plus an additional "Project Detail" section with the sub-folder breakdown per vault. Written into your vault via the "Create Vault Token Usage Projects report" command (or the path configured in Settings). Handy to hand to a client as a usage/billing reference, separate from your personalToken Usage Report.md.
History: the per-vault (and per-project) breakdown is written into the same daily archive files (see Archive below) as a nested byRoot: block in the frontmatter, so it survives beyond your Claude data retention window exactly like the rest of the archive — no separate backfill step needed.
Screenshot
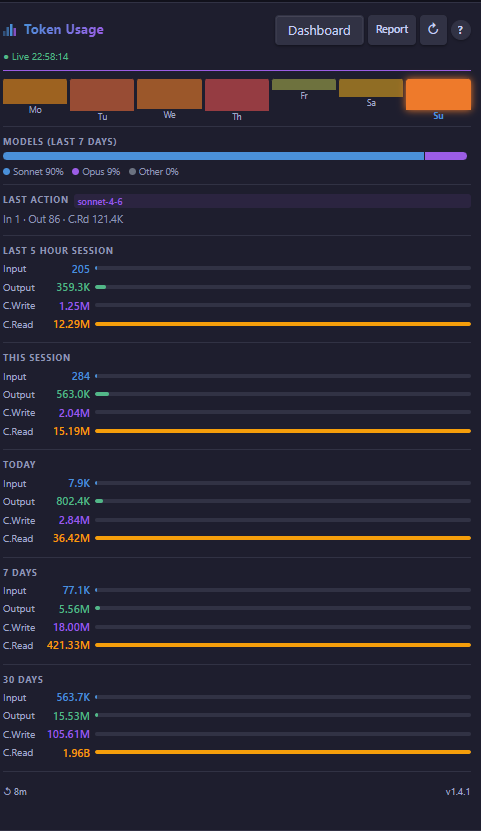
Real-time Claude Code token usage in the Obsidian sidebar.
What You See in the Sidebar
Last 5 Hour Session
A rolling window covering the past 5 hours — matching Claude Code's own rate-limit period. Shows Input, Output, C.Write, and C.Read as separate rows. Sub-label: "Rolling window · counts toward rate limit".
This Session / Today / 7 Days / 30 Days
Four time-range sections, each showing the same four token rows. A small logarithmic bar next to each value keeps all token types visually readable even when magnitudes differ by orders of magnitude (e.g. Input at a few hundred vs C.Read in the millions).
This Session and Today carry a dynamic sub-label explaining their scope:
- This Session — shows the session start time ("Started today at 09:27" or "Started yesterday · spans multiple days"). A session in Claude Code can span multiple calendar days — so "This Session" may be larger than "Today". This is expected.
- Today — always shows "Calendar day · since midnight".
These three views — Last 5 Hour Session, This Session, and Today — are independent cuts through the same data. They do not automatically nest inside each other. See the help page for a full explanation.
Models (last 7 days)
A stacked percentage bar showing the model distribution across the past 7 days, colored by model family:
| Model | Color |
|---|---|
| Haiku | Cyan |
| Sonnet | Blue |
| Opus | Purple |
| Fable | Amber |
| Other | Gray |
C.Write and C.Read
Cache Write (C.Write) and Cache Read (C.Read) are shown as separate rows throughout the sidebar because they have very different cost implications:
- C.Write (purple) — approximately 1.25× standard input price. A one-time cost to establish the cache.
- C.Read (amber) — approximately 0.10× standard input price. Ten times cheaper than regular input.
The ratio C.Read ÷ C.Write is the Reuse Factor. A high value means the same context is being reused efficiently across many requests.
Dashboard
The dashboard button in the sidebar header generates a self-contained HTML report and opens it in your default browser.
The dashboard includes:
- Summary cards — total tokens, requests, active days, and average tokens per active day, all scaled to your selected Report period (30 days / 60 days / 6 months / 12 months)
- Daily stacked bar chart — input, output, and cache tokens by day across the full Report period, blending live session data with the daily archive for anything older than your Claude data retention
- Cache efficiency section — line chart with C.Write and C.Read across the full Report period, Reuse Factor card, and a dynamic interpretation of your usage pattern
- Model distribution donut — share of each model family over your live data window (recent days, not the full Report period — the archive stores aggregates, not individual requests)
- Request size histogram — distribution of tokens per individual request, live data window only, same reason
- Top sessions table — the 10 most token-intensive sessions by date and identifier, live data window only, same reason
- Projects tab — token usage broken down by vault/project: an overview (which vault, total tokens, share of the whole, active days, first/last active date) plus a day-by-vault detail table for the selected Report period. See Vault / Project Breakdown below.
The dashboard uses Chart.js (loaded once from CDN) and works offline after the first load.
Help Panel
The "?" button in the sidebar header toggles between the data view and a built-in glossary. A "← Back" button appears in the header while the glossary is open — click it to return to the data view without hunting for the "?" button again.
The glossary explains:
- What a token is
- The difference between Input and Output
- What C.Write and C.Read mean and why they matter
- How to read the Reuse Factor
- What the 5-hour session window represents and why the countdown shows a tilde (~)
- How the three time views (Last 5 Hour Session, This Session, Today) relate to each other
- How the model colors map to model families
- How sessions are counted
- Approximate API cost reference per model
A link at the bottom of the glossary opens the full documentation page at langeatn.de/media/token-usage/ in your browser — installation, data sources & transparency, core concepts, the archive, the dashboard, every setting, pricing, and an FAQ, all on one searchable page. The page is available in English, German, and French.
Report
The "Create Token Usage report" command (also available via the document icon in the sidebar header) writes a Markdown report file to your vault. The report covers:
- Last action with all four token types
- Current session and today
- 7-day and 30-day summaries
- Cache efficiency ratio over 30 days
The report path is configurable in Settings.
Archive
Claude Code deletes its own session files automatically (30 days by default, configurable via cleanupPeriodDays). Once a day's file is gone, no plugin can read it — so Token Usage keeps its own compact, long-term record.
Every day you use Claude Code, the plugin writes one small Markdown file to Token Usage Archive/ in your vault: YAML frontmatter with the day's totals (input, output, cache write, cache read, calls, sessions, model distribution) plus a short human-readable table. It never stores your actual conversations — aggregates only.
On every refresh, the plugin checks all days still available in Claude Code's local files and backfills any day that doesn't have an archive entry yet. This covers a first install (your existing history gets archived immediately) and reopening after Obsidian was closed for a while (any gap gets filled in, as long as Claude Code hasn't already deleted it).
The archive is on by default and can be turned off in Settings, along with the folder path. See Known Behavior for the honest limit on how far back this can reach.
The dashboard and report read the archive back, not just write to it. A "Report period" setting (30 days / 60 days / 6 months / 12 months) controls how far back the daily trend chart, cache-efficiency line, and summary cards go. Anything within your Claude data retention comes from live session files; anything older is filled in from the daily archive automatically — no manual switching between sources. Since a longer period can span vacations, gaps, or quiet weeks, the "Active days" card always shows how many of the selected days actually had usage, and the average-tokens figure is computed per active day, not per calendar day, so a slow month never distorts the number.
Installation
Community Plugin Directory (recommended)
- Open Obsidian Settings → Community Plugins
- Search for Token Usage
- Install and enable
Manual Installation
- Download the latest release assets:
main.js,manifest.json,styles.css - Create the folder
<vault>/.obsidian/plugins/token-usage/ - Copy the three files into that folder
- Restart Obsidian
- Enable Token Usage under Settings → Community Plugins
Usage
After enabling the plugin:
- Click the activity icon in the left sidebar to open the Token Usage panel.
- Use Claude Code normally — the panel updates automatically whenever a new response is recorded.
- Click the chart icon in the panel header to open the HTML dashboard.
- Click ? to toggle the built-in glossary.
No additional setup, API keys, or cloud services required.
Command Palette
| Command | Action |
|---|---|
| Open Token Usage | Opens the sidebar panel |
| Create Token Usage report | Writes a Markdown report to your vault |
| Open Token Usage dashboard | Generates and opens the HTML dashboard |
| Create Vault Token Usage Projects report | Writes the per-vault/project breakdown as a separate Markdown file to your vault |
Settings
| Setting | Default | Description |
|---|---|---|
| Language | English | Display language for the plugin UI. Switches immediately without restart. Available: English, Deutsch, Français, Italiano. |
| Auto-Refresh (seconds) | 30 | Fallback polling interval in addition to the live file watcher |
| Report path | Token Usage Report.md | Vault-relative path for the generated Markdown report |
| Vault report path | Vault_Token_Usage_Projects.md | Vault-relative path for the per-project/vault usage breakdown, a separate file from the main report |
| Dashboard path | Token Usage Dashboard.html | Vault-relative path for the generated HTML dashboard |
| Report period | 30 days | How far back the dashboard and report look: 30 days, 60 days, 6 months, or 12 months. Beyond your Claude data retention, filled in from the daily archive |
| Enable daily archive | On | Automatically writes a daily Markdown summary to your vault. Turn off if you don't want the plugin creating files |
| Archive folder in vault | Token Usage Archive | Vault-relative folder for the daily archive files |
| Claude data retention (days) | 30 | Reads and writes cleanupPeriodDays directly in Claude Code's own settings.json. A backup (.bak) is created automatically before each change |
Privacy
Token Usage is built with a local-first philosophy.
- No data is sent to external services
- No telemetry
- No API keys required
- No cloud processing
- All calculations are performed locally on your device
Your Claude Code usage data stays on your machine.
Known Behavior
Claude Code updates may briefly affect historical data.
Token Usage reads the JSONL files that Claude Code writes locally. When Anthropic ships a Claude Code update that changes how session data is recorded or how internal telemetry is counted, historical values in the 30-day view may temporarily show anomalies.
We review Anthropic's release notes with each Claude Code update and adapt the plugin where needed. Significant compatibility changes are documented in the changelog.
Note for Claude Code v2.1.196 (August 2026): This update fixed a bug where parallel requests were double-counted in telemetry output. Sessions recorded before the fix may show slightly elevated values in the 30-day view. This resolves automatically as those sessions age out of the 30-day window — expected by approximately end of August 2026.
Version number in the sidebar footer shows an outdated version after an update.
This is not a code bug. Obsidian caches the loaded plugin manifest in memory. Toggling the plugin off and on may not fully reinitialize the manifest object. Fix: perform a full Obsidian restart after updating the plugin files. The correct version will display after restart.
The weekly consumption chart uses Claude's billing week boundary.
The dashboard's weekly bar chart aligns to Claude's billing cycle: Sunday 18:00 → Sunday 18:00 Europe/Berlin (= Sunday 16:00 UTC). Weeks where the weekly rate limit was reached are highlighted. Token counts in the rate limits table show the full billing-week total for weekly hits and the 5h window total for session hits — these are the metrics that directly correspond to each limit type.
The 5-hour reset countdown may differ from Claude's own display.
The footer shows "Claude 5h resets in: Xh Ym". The tilde () is intentional — it signals an approximation. Claude Code writes session data to local files after each response completes, not at the moment you send your first message. A long first response (context loading, file reading) can take 10 to 25 minutes before anything is written to the log. The plugin's countdown therefore starts from the first recorded timestamp, which may lag behind the actual session start. For the precise reset time, check the plan usage section in Claude Code or on claude.ai.
The archive backfills, but only what still exists on disk.
Claude Code deletes its own session files automatically — 30 days by default, or whatever you've set for cleanupPeriodDays. The plugin's archive (a small Markdown summary per day, written to a folder in your vault — see Archive below) exists to survive that deletion. Every time the plugin refreshes, it checks all days still available locally and backfills any day that doesn't have an archive file yet — including a first install (it archives your existing history immediately) and reopening after Obsidian was closed for a while.
The limit is physical, not a bug: the archive can only save what's still on disk at the moment it runs. If Obsidian stays closed longer than your retention period, the days in between are deleted by Claude Code before the plugin ever gets a chance to see them, and that gap is unrecoverable. If you use Obsidian less than daily, increase "Claude data retention (days)" in Settings to widen the safety margin.
Contributing
Contributions, bug reports, feature requests, and suggestions are welcome.
- Fork the repository
- Create a feature branch
- Commit your changes
- Open a pull request
Support
If you encounter a problem or have an idea for improvement, please open an issue in the GitHub repository.
Full documentation, glossary, and manual — installation, data sources & transparency, core concepts, settings reference, FAQ, all searchable on one page: langeatn.de/media/token-usage/
License
MIT License — see the LICENSE file for details.
Acknowledgments
- Obsidian
- Anthropic Claude Code
- The Obsidian Plugin Community
Changelog
v1.8.0 — September 2026
- Activity calendar (NextGen sidebar) — a month grid pinned to the bottom of every rail page, one colored dot per day sized against your own recent daily average (green below, amber around, red for a 2×+ spike). Navigate back through your history; toggle it off under Settings → Activity calendar
- Claude desktop app usage now counts — the agent mode built into the desktop app runs Claude Code and writes the same JSONL session logs to its own location; the plugin now reads those too, so that consumption no longer goes missing from your totals and rate-limit estimates. A one-time archive rebuild on first launch backfills the affected days
- Dashboard: expandable sub-project detail — the Projects view stays one row per vault by default; tick "Show sub-project detail" to expand any vault and see its per-subfolder token split inline, not only in the Markdown export
- Clearer scope — a new "What is measured" glossary entry and dashboard note make explicit that the plugin covers Claude Code everywhere, but not ordinary Claude chat (which writes no local token counts)
- Manual — a chapter-by-chapter guide is taking shape at langeatn.de/media/token-usage/manual/; the outline is live, content fills in over the coming releases
v1.7.1 — September 2026
- NextGen sidebar (opt-in, Settings → Sidebar appearance, Classic sidebar unchanged by default) — icon rail navigation (Today / Overview / Settings), a 7-day activity heatmap, and colored KPI tiles with trend sparklines
- Vault Token Usage Controlling — the Dashboard's new Projects view breaks token usage down by vault and sub-project, so you can track and compare consumption across multiple vaults (e.g. separate client workspaces) from one place. Sortable overview and day-by-vault detail tables (click any column header, "today first" default), plus a standalone
Vault_Token_Usage_Projects.mdexport for billing - Redesigned Dashboard — 5 KPI cards (weekly forecast, limit health, cache efficiency, daily velocity, focus score), a week status bar with on-track forecast, a period dropdown (30/60/180/360 days), and a new Reports tab
- Historical reporting beyond 30 days — daily usage is now archived directly in your vault, so 60/90+ day views keep working even after Claude Code rolls off its own local logs
- Configurable Claude data retention — control how long the original session log files are kept on disk, right from the plugin settings
- In-app "What's new" popup — after updating, a short summary of the latest changes appears once. Reopen it anytime via Command Palette → "Show what's new"
v1.6.0 — August 2026
- Multilingual UI — English, German, and French. Language dropdown in Settings switches immediately without restart. French translation reviewed by a native speaker.
- Settings button (⚙) in the sidebar header — opens the plugin settings tab directly without navigating through the Obsidian menu
- Rate limit auto-detection — session and weekly limit hits are now read automatically from Claude Code's local JSONL files. No manual button needed. The plugin detects the exact moment a limit was reached and which type it was (session vs. weekly)
- Dashboard: Rate limits section — table of all detected limit events with the relevant token metric at the time of the hit (5h window for session limits, full billing-week total for weekly limits), plus empirical estimates for session and weekly limit thresholds derived from your own usage history
- Dashboard: Weekly consumption chart — 6-week bar chart aligned to Claude's billing week boundary (Sunday 18:00 → Sunday 18:00 Europe/Berlin), with visual highlight for weeks where the weekly limit was reached
- Spike warning — amber badge next to Today when daily consumption is ≥ 2× your personal 29-day average (active days only)
- Last Action chips — four colored chips (In / Out / C.Wr / C.Rd) replace the plain-text row in the Last Action section, consistent with the minibar color scheme throughout the sidebar
- Collapsible sections — all five time-range sections can be collapsed individually with a click. State persists across data refreshes
- Window cleared indicator — shows "Window cleared · full 5h available" in green when the 5h window is empty but activity was recorded in the past 6 hours
- Bugfix — zero-token entries are now filtered from the 5h window and no longer affect the countdown or display
v1.5.0 — August 2026
- Context sub-labels under each section title — shows exactly what each time range covers at a glance ("Rolling window · counts toward rate limit", session start time, "Calendar day · since midnight")
- ← Back button in the glossary header — returns to the data view without hunting for the ? button
- Logarithmic minibar scale — all four token types (Input, Output, C.Write, C.Read) stay visually readable even across large magnitude differences
- Sticky header — logo and buttons stay pinned when the panel is small or scrolled
- Bugfix — C.Write bar was invisible due to a missing CSS class (
.au-bar-purple) - New glossary entry — "The three time views" explains how Last 5 Hour Session, This Session, and Today are independent cuts through the same data
- GitHub artifact attestations — release assets are now cryptographically signed
v1.4.1 — August 2026
- Redesigned logo header with SVG chart icon and gradient text
- Built-in glossary panel — toggle with the ? button, explains all token concepts and includes an approximate cost reference
- HTML dashboard — 30-day charts, model donut, top sessions table, cache efficiency analysis
- C.Write and C.Read split into separate rows throughout the sidebar
- 7-day stacked model distribution bar (Haiku / Sonnet / Opus / Fable)
- Help page at langeatn.de/media/token-usage/ (English and German, auto-detected)
v1.0.0 – v1.0.2 — July 2026
- Initial release
- Live file watcher on active Claude Code session
- Token breakdown across Last Action, This Session, Today, 7 Days, 30 Days
- Fallback polling interval (configurable)
- Approved and listed in the Obsidian Community Plugin Directory
Built to answer a simple question:
"Where did all my tokens actually go?"
For plugin developers
Search results and similarity scores are powered by semantic analysis of your plugin's README. If your plugin isn't appearing for searches you'd expect, try updating your README to clearly describe your plugin's purpose, features, and use cases.