DataDeck
approvedby SVM0N
View and edit CSV files as cards, kanban, table, charts, a habit dashboard, a tasks board, a focus reader, or an interactive travel map. Charts with best-fit lines, formulas, and color-by splits. Notes columns render as Markdown. - This plugin has not been manually reviewed by Obsidian staff.
DataDeck
Your CSV files, alive inside Obsidian. DataDeck opens plain .csv files
as rich, editable views — cards, kanban, an editable table, charts with
best-fit lines and formula overlays, a habit dashboard, a tasks board, a
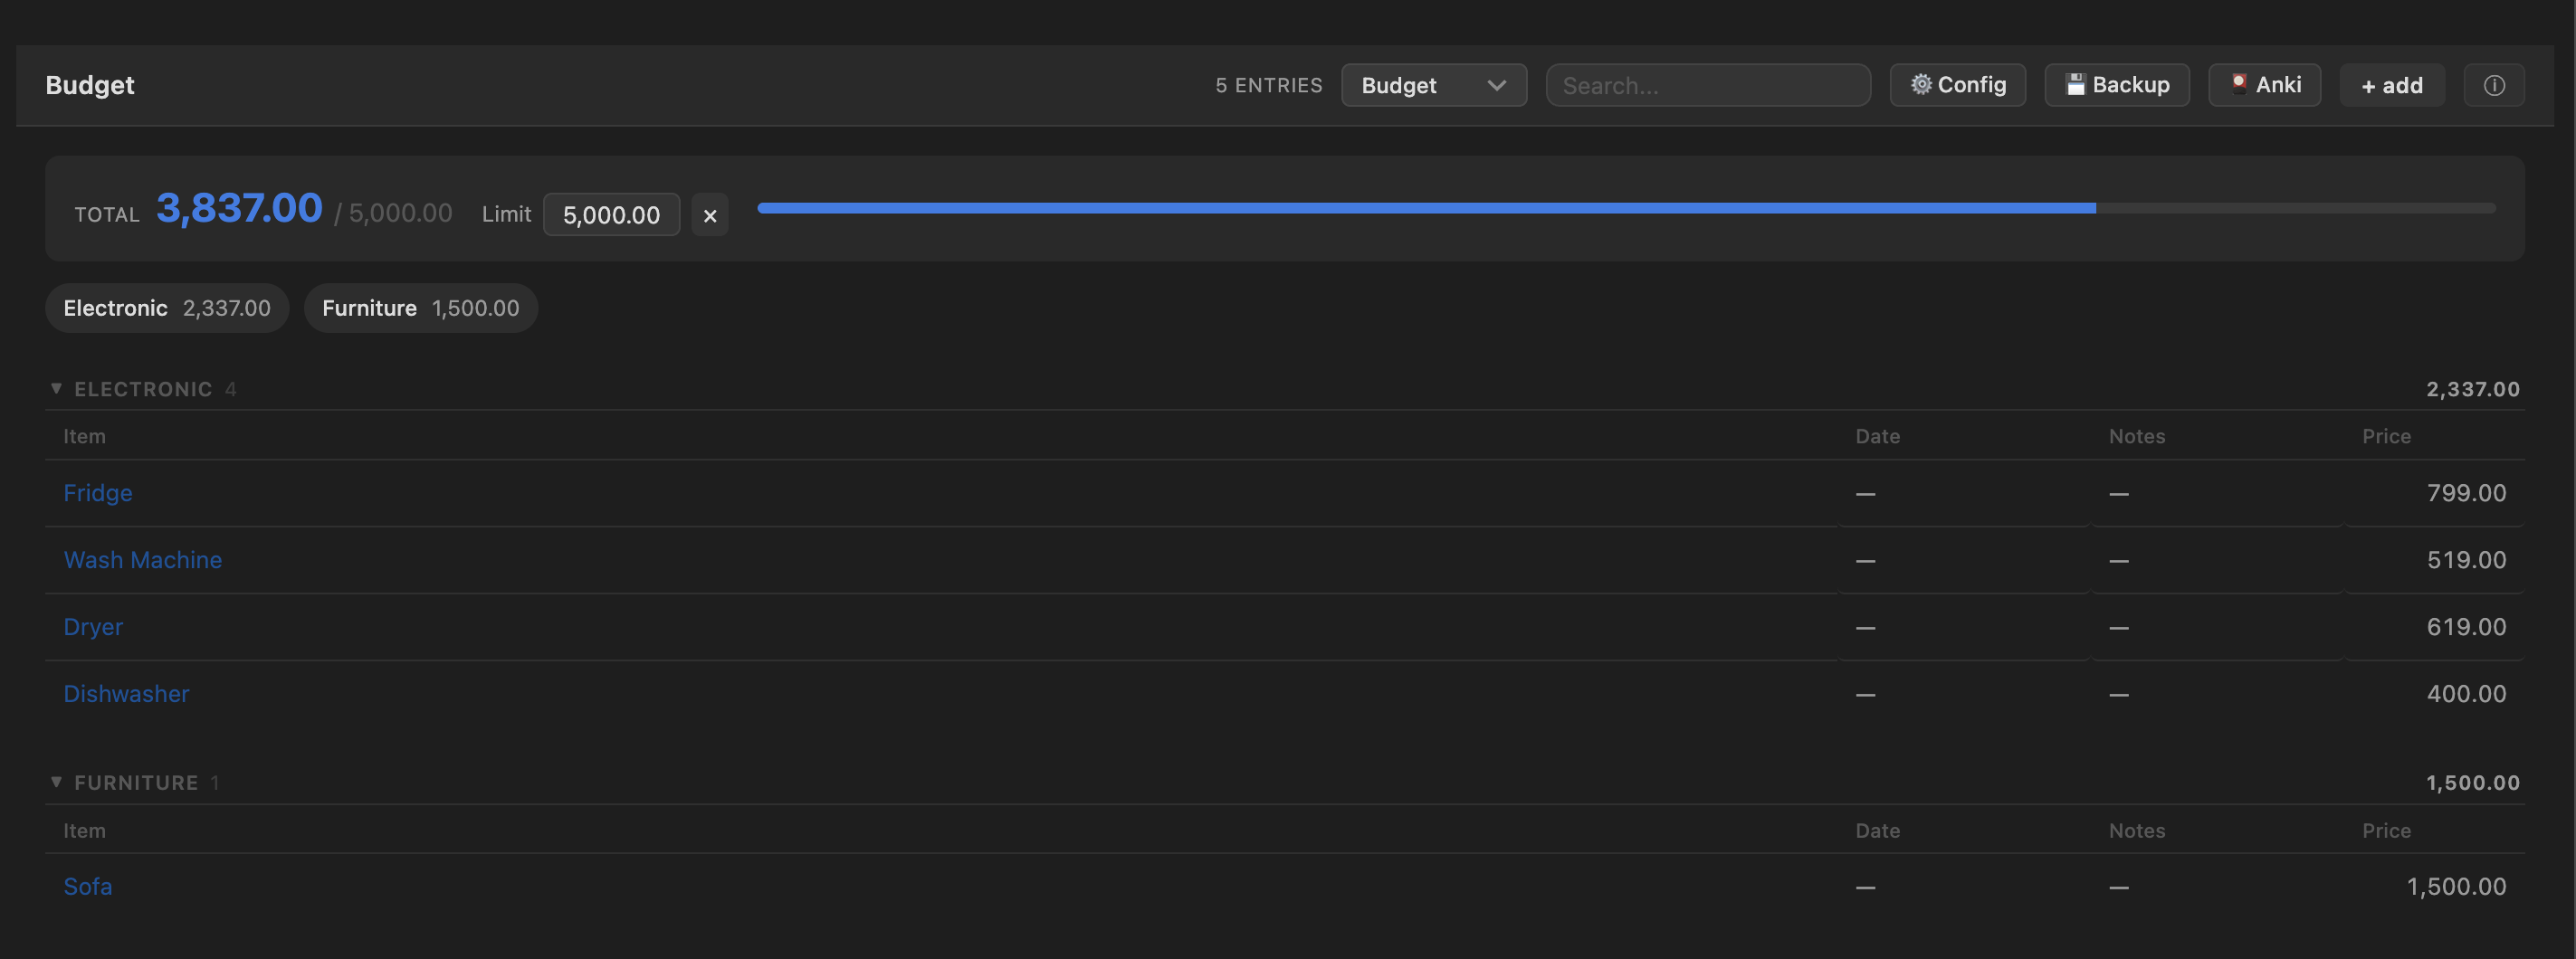
budget tracker with per-category rollups against a spending limit, a
one-entry-at-a-time focus reader, and an interactive travel map. Everything
edits in place and writes straight back to the one canonical CSV file: no
database, no shadow copies, no lock-in. Your data stays a text file that
diffs, syncs, and outlives any tool.
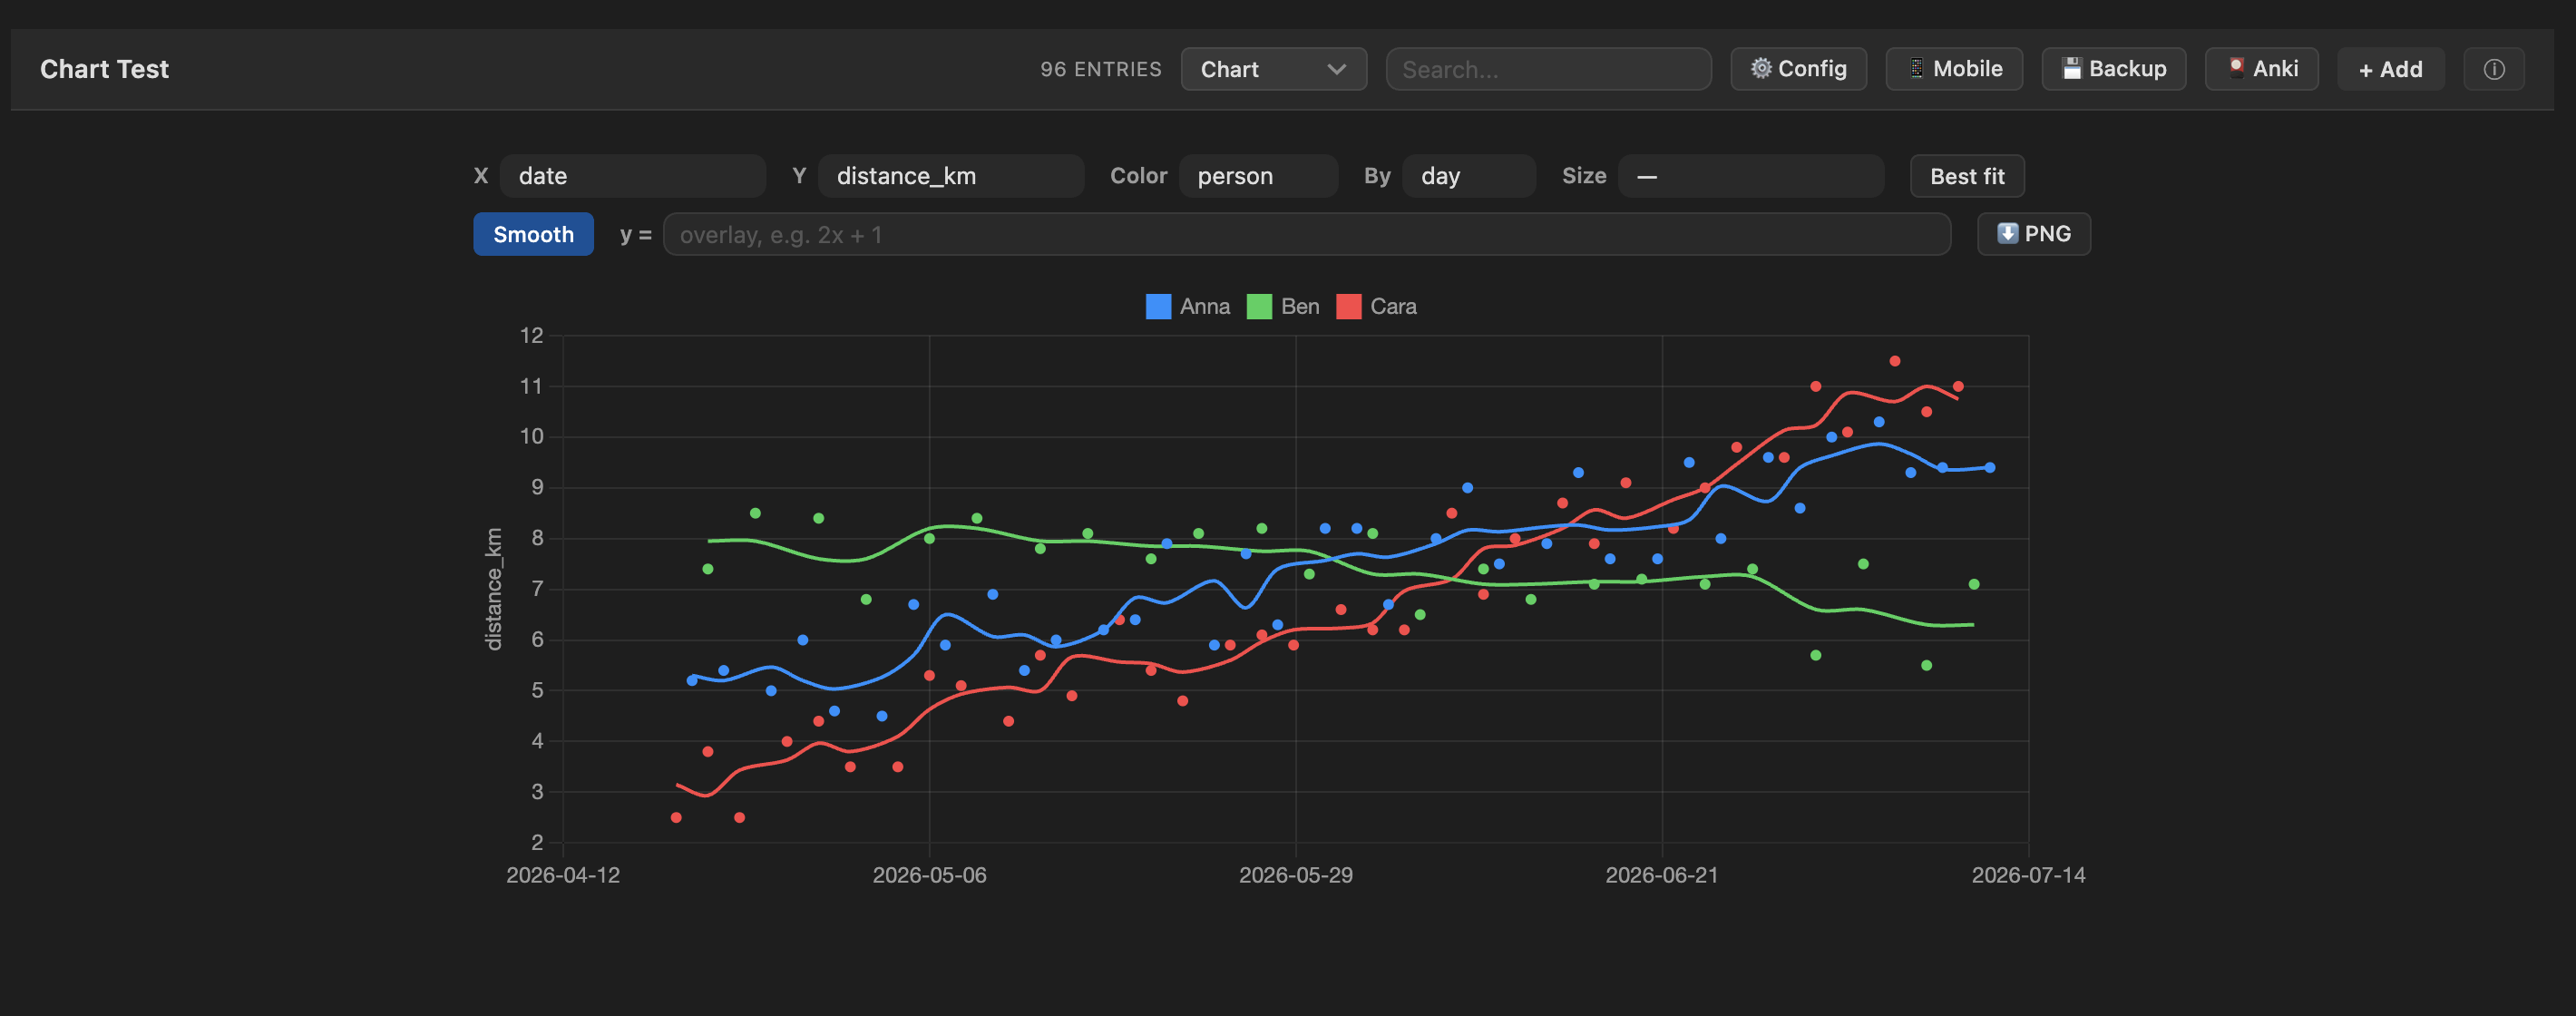
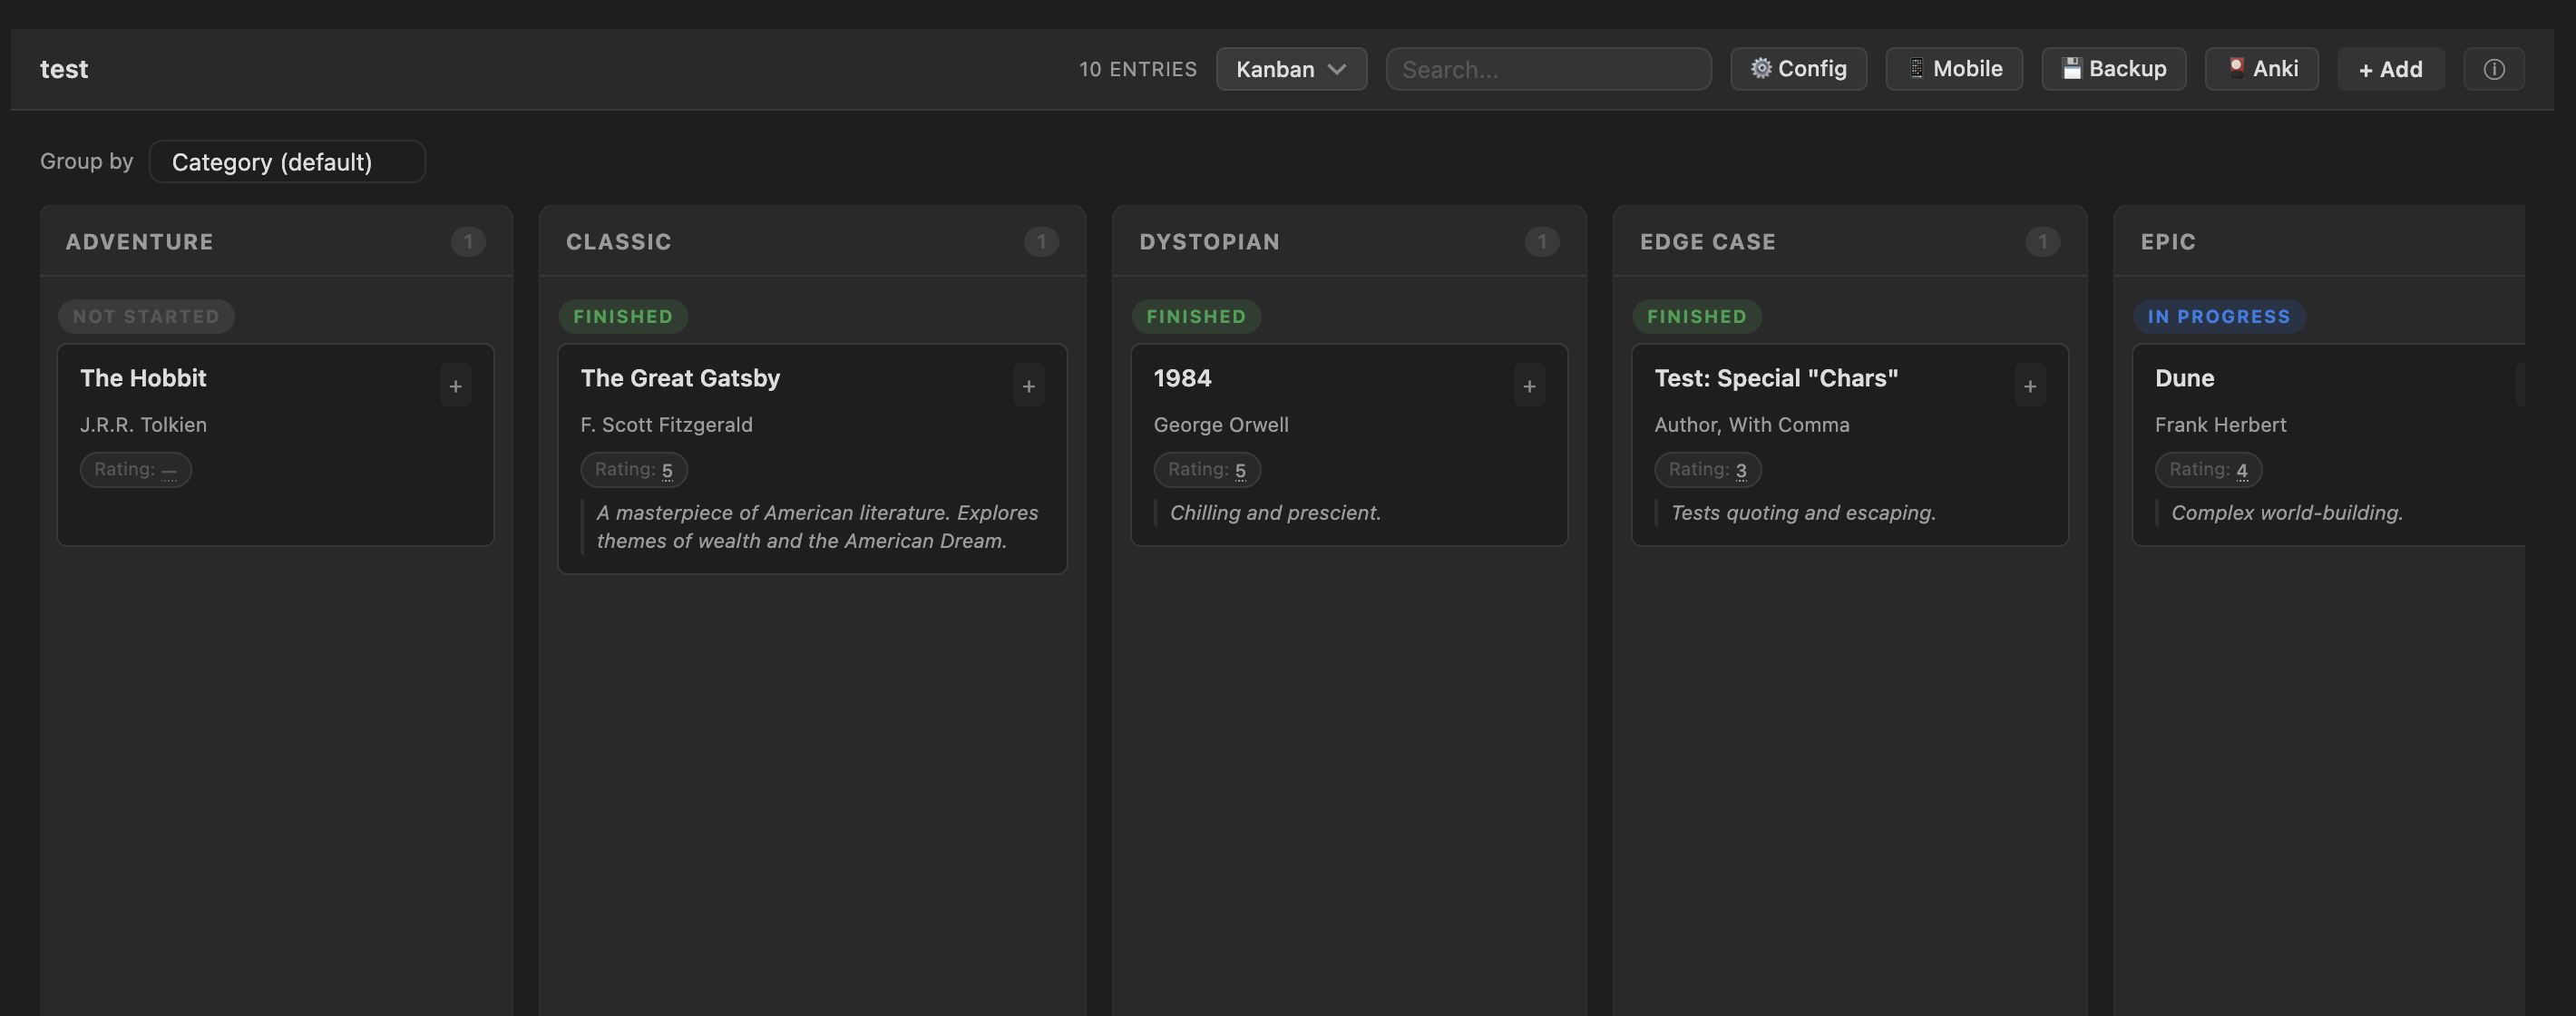
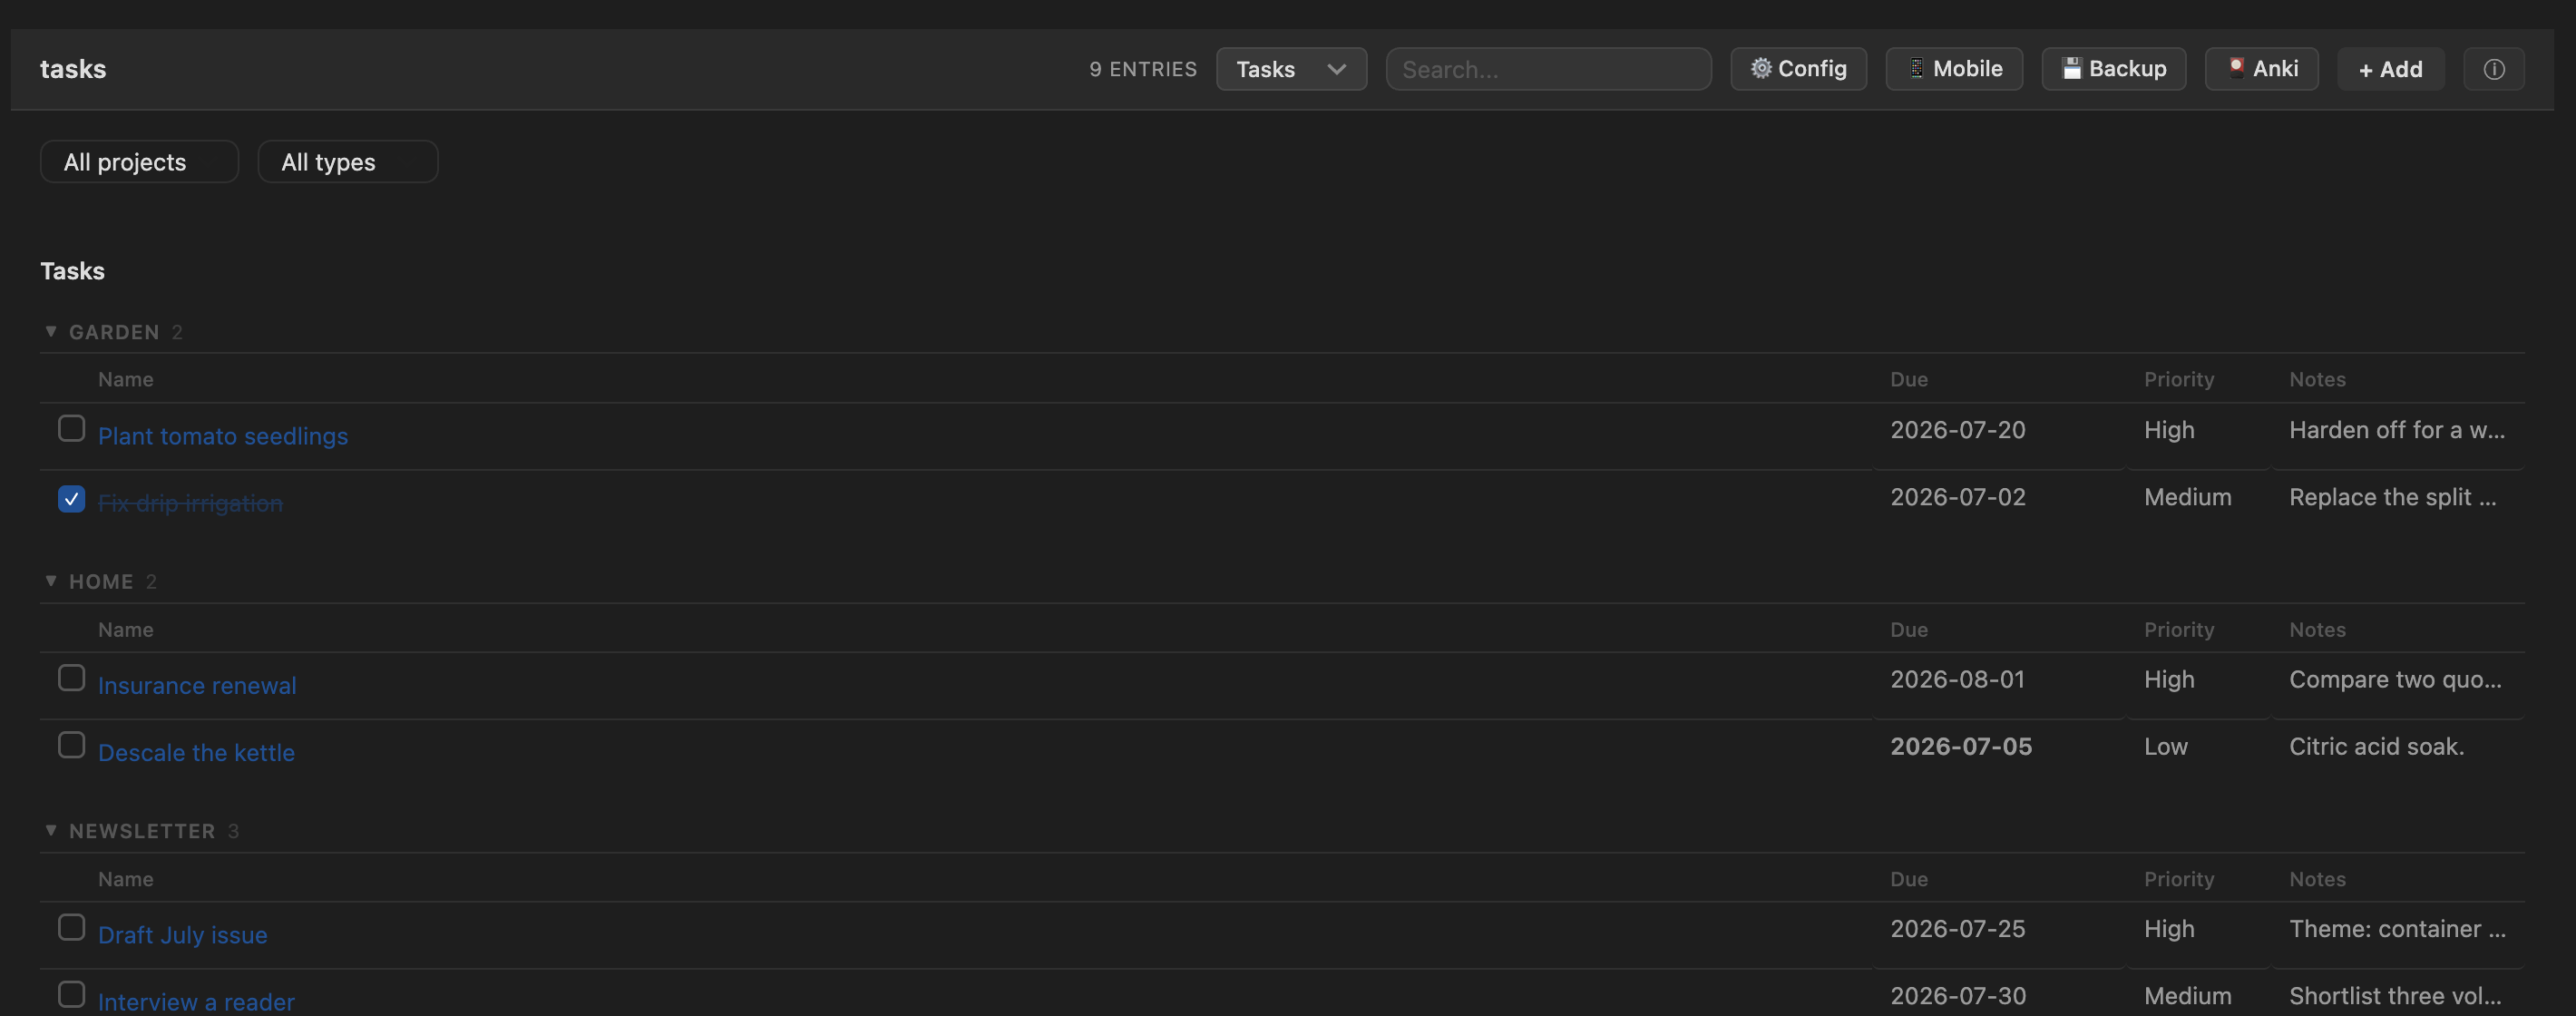
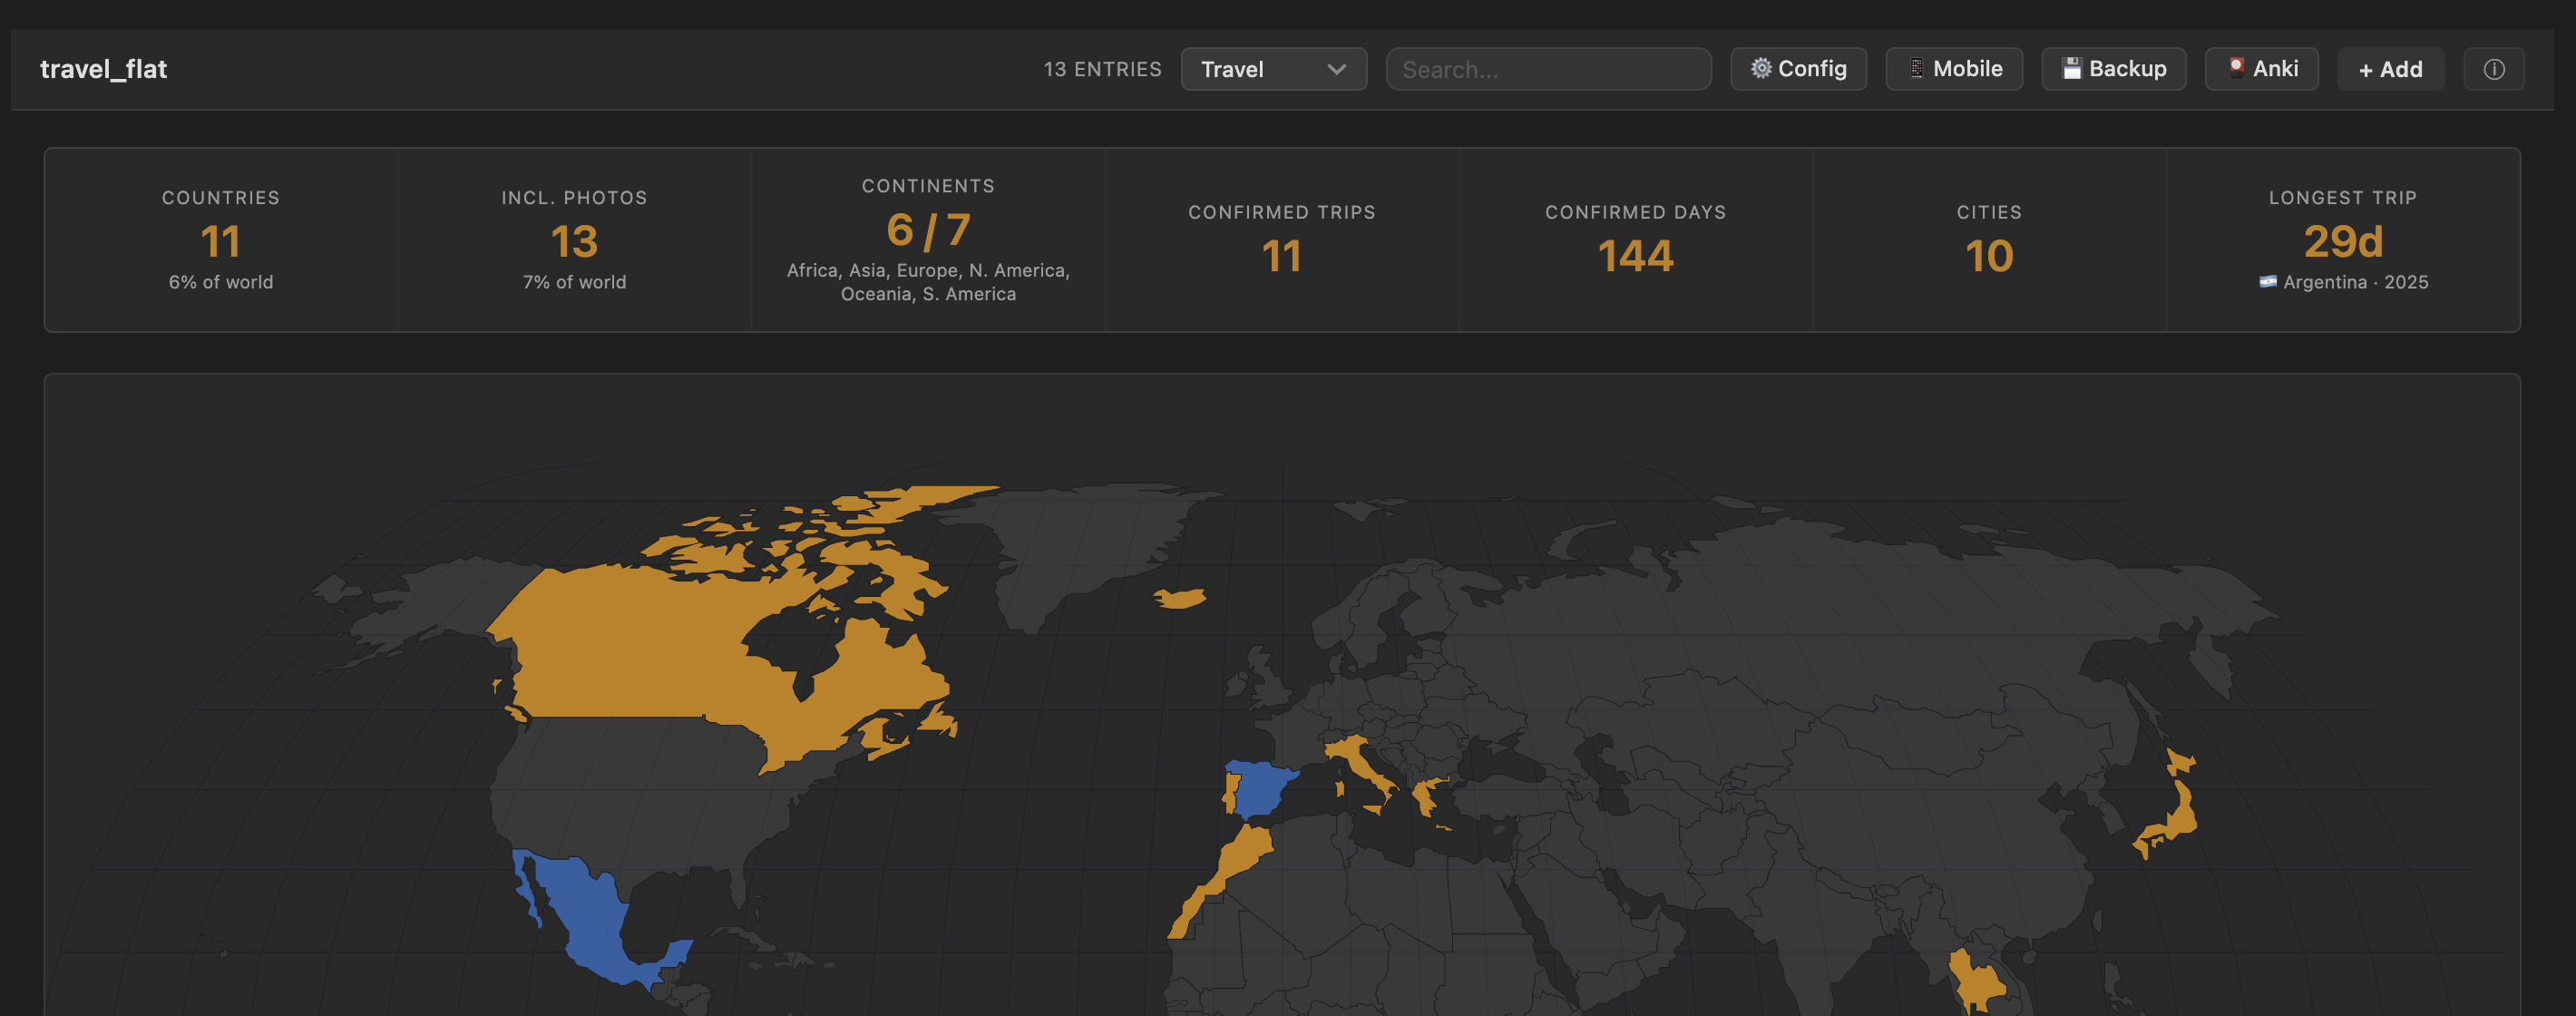
Screenshots — chart, kanban, tasks board, budget tracker, and the travel map
 |  |
 |  |
 | |
Highlights
- Eleven view modes, auto-offered based on the columns in the file — a books CSV gets a library, a habit log gets a dashboard, a tasks file gets a project board, an expenses CSV gets a budget tracker, a travel log gets a world map, a Start/End dated log gets a Gantt-lite timeline.
- Everything is editable — click a cell, toggle a habit, drag nothing: edits debounce-save back to the CSV. Notes-style columns render and edit as Markdown.
- Charts like a tiny ggplot: scatter/line of any column pair, color-by
category (hue), size-by, per-series least-squares fits with R²,
y = f(x)formula overlays, week/month bucketing, rolling-average smoothing, bar aggregates for categorical axes, and one-click PNG export. - Embed blocks put live views inside any note:
csv-view(table / cards / kanban),csv-chart,csv-tasks(a cross-file tasks board),csv-random(quote of the day), andcsv-add(a mobile-friendly entry form). - Sync-safe saves — if the file changed on disk while you were editing
(another device, another tab), the other version is stashed to
Archive/instead of being silently overwritten. - Works on mobile. Compact toolbars, one-scroll modals, touch-friendly pickers.
Installation
Until DataDeck is in the community store:
- Via BRAT: add
SVM0N/datadeckas a beta plugin. - Manual: grab
main.js,manifest.json, andstyles.cssfrom the latest release into<vault>/.obsidian/plugins/datadeck/, then enable DataDeck in Settings → Community plugins.
The travel view's world map is bundled straight into
main.jsat build time (no separateworld-map.svgto copy) — Obsidian's plugin installer only ever fetches those three files, for community-store installs too.
Quick start
- Open any
.csvfile — DataDeck takes over the tab and picks a sensible view from the columns it finds. - Switch views with the toolbar dropdown; ⚙ Config sets per-file column roles (title, category, status, notes, image…), column types (checkbox / categorical / date), and the default view.
- + Add opens an entry form with the right control per column: dropdowns for categorical columns, a date picker for dates, toggles for 0/1 habit columns, a Markdown textarea for notes.
- No CSV yet? Run a palette command: Create tasks / travel / habit tracker / chart / timeline file scaffolds one preconfigured for its view.
View modes
The toolbar dropdown offers only the modes that make sense for the file's columns:
| Mode | Appears when… | What it shows |
|---|---|---|
| Table | always | Editable spreadsheet: resizable columns, click-to-sort headers, sticky header, inline thumbnails for an image column (several per cell when ;-separated) |
| Cards | any groupable column | A library grouped by category — status dots, star ratings, tags, cover images, per-file sort |
| Kanban | any groupable column | Columns by category (or any column via "Group by" — year columns bucket into decades), status subgroups, inline note editing |
| Chart | a numeric column (2+ rows) | Scatter/line of any column pair with hue, size-by, fits, formulas, smoothing, bucketing, and bar aggregates — see Charts |
| Dashboard | a date column | Habit tracker: daily toggles, progress chart, streaks, per-habit GitHub-style calendars |
| Tasks | due/priority columns, or task-like type values | Project board: rows grouped by project, split into Tasks / Idea / Note sections, click-to-toggle done, overdue flags, filter by project / type / done-or-open |
| Timeline | a Start column plus an End/Due column | Gantt-lite horizontal timeline: one row per entry, drawn as an arrow spanning Start → End against a shared time axis; open-ended entries stretch to today, a dashed line marks "now", filter by category |
| Budget | a Price/Cost/Amount/Total column (or one assigned in ⚙ Config) | Items grouped by category with per-category subtotals and a grand total, set an inline spending limit and the total turns blue under it, red over |
| Stats | a category/status/rating/author column | Bar-chart insights: status breakdown, categories, rating histogram, entries per year — bars click through to the filtered library |
| Focus | any non-empty file | One entry at a time with big typography — built for quotes and vocabulary. ←/→ keys navigate |
| Travel | country + trip-date columns | World choropleth, trip timeline, per-country day totals, residency day-counters — see Travel view |
Charts
Pick Chart in the toolbar (or embed a csv-chart block):
- X / Y — any numeric or date column; a date X renders a connected time series, numeric pairs render as scatter dots.
- Color — ggplot-style hue: one colored series per value of a categorical column.
- Size — a numeric column mapped to point radius (area-true sqrt scale).
- Best fit — per-series least-squares line with the equation and R² (phrased as an per-day trend for date axes).
- Smooth — a 7-day rolling average drawn over faint raw dots.
- By week / month — bucket a time series with a sum / avg / count aggregate ("km per week, one line per person").
- Bar mode — pick a categorical X and the chart becomes bars with a count / sum / avg aggregate; hue makes grouped bars; comma-separated columns (genres, tags) count once per value.
y = f(x)overlay — type2x^2 - 3x + 1or10 sin(x/2); parsed by a small built-in evaluator (+ - * / % ^, parentheses, implicit multiplication,sin cos tan sqrt log ln exp abs floor ceil round min max pow,pi/e). Noeval.- ⬇ PNG — saves the chart as an image next to the CSV.
Embed blocks
Live views inside any note. All paths resolve like links: a bare name is a
sibling of the note, ../ walks up, and anything else is vault-relative.
csv-view — table / cards / kanban in a note
```csv-view
file: ../movies.csv
mode: kanban             ← table | cards | kanban   (default: table)
height: 480              ← optional max content height in px
collapse: Removed, Done  ← optional: card groups collapsed by default
columns: Title, Rating   ← optional: show only these columns, in this order
hide: Notes, Source      ← optional: drop these columns from the display
```
Fully editable — inline cells, status chips, the entry expander, + Add, and delete-with-undo all write back to the source CSV. Other open views of the same file re-sync automatically.
columns: and hide: change what the block draws — a hidden column is
still searched, still written back on save, and still editable in the entry
expander. Names match the CSV's headers case-insensitively; ones the file
doesn't have are ignored. They apply to the block's table columns and its
card/kanban fields.
Table mode inside a block uses a narrower column floor than a full tab does (the note's text column is much narrower than a leaf), so a few-column sheet fits instead of scrolling sideways, and its header scrolls with the rows rather than staying frozen — a block is a screenful, and a frozen header inside a note is drawn over by the rows passing under it.
csv-chart — a chart (or pure function plot) in a note
```csv-chart
file: ../health.csv      ← omit for a formula-only plot
x: date                  ← default: date column, else first numeric
y: weight                ← default: first numeric column ≠ x
hue: person              ← optional color-by column
size: effort             ← optional numeric column → point radius
agg: sum                 ← aggregate for bar mode / bucket (count | sum | avg)
bucket: week             ← date X only: week | month buckets
smooth: true             ← date X only: rolling mean (true = 7 days, or a number)
fit: linear              ← best-fit line(s) with equation + R²
formula: 0.5x + 2        ← y = f(x) overlay; the whole plot when there's no file
xmin: -10                ← formula-only domain (default -10 … 10)
xmax: 10
height: 280
```
Read-only; re-renders when the source CSV changes.
csv-tasks — a cross-file tasks board
```csv-tasks
folder: Projects         ← scan recursively for task-shaped CSVs ("/" = whole vault)
files: extra.csv         ← and/or an explicit comma-separated list
height: 600
```
Merges task rows from many CSVs into one board. Columns map onto a canonical
set (Title / Type / Project / Priority / Due / Status / Notes) by name
aliases — deadline, state, kind, area… all resolve. A file without a
Project column uses its basename as the project, so one-CSV-per-project
folders just work. Every edit writes back to the row's source file;
right-click a row for "Open source".
csv-random — a random entry (quote of the day)
```csv-random
file: ../quotes.csv
field: Quote             ← optional; defaults to the first column
```
Re-rolls on every render and via its ↻ button — made for daily-note templates.
csv-add — an entry form in a note
```csv-add
file: ../habits.csv
```
A compact, grouped add/update form (date pre-filled with today, toggles for habit columns, dropdowns with a custom escape hatch). On habit-tracker files it pre-fills from the existing row for the picked date, so updating a day never wipes what's already logged.
Travel view
For a flat travel CSV with these columns:
date_entered,date_left,country,city,visa_status,notes,source,resolved
countryis ISO-2 (US,FR, …);sourceisconfirmed,inferred(e.g. photo-derived), orconflict.- Confirmed countries render gold; photo-only countries blue; conflict rows and photo rows overlapping a confirmed trip are excluded from counts.
- Click a country (map, table, or timeline) for a per-country trip panel.
- Blank/partial dates (
2022-06-??) are allowed — visited-but-undated. A blankdate_leftcounts as an ongoing stay ("📍 Currently in …").
Residency counters
Configurable day-gauges (e.g. Schengen 90/180) render in the travel view. Each rule counts days in the listed countries within a window (calendar year / rolling N days / all time), minus exempt visa rows, against a threshold. Add rules in Settings → DataDeck → Residency rules. These are indicators, not legal or tax advice.
Anki sync
The 🎴 Anki toolbar button pushes rows to Anki as flashcards — great for quotes and vocabulary files. One Basic note per row: the front is the title column (or your ⚙ Config pick), everything else joins onto the back. Decks are named after the file and re-syncs skip cards that already exist, so it's safe to click repeatedly.
Requires the AnkiConnect
add-on and the Anki desktop app running; desktop-only (it talks to
http://127.0.0.1:8765).
Styling a column
Every header and cell carries its column name as data-col, so a CSS snippet
(Settings → Appearance → CSS snippets) can style one column:
/* Big serif hanzi in the Character column */
.csv-table td[data-col="Character"] {
  font-family: "Songti SC", serif;
  font-size: 26px;
}

/* Images: fill the column's width instead of being capped at 56px tall */
.csv-table td[data-col="Image"] { --csv-img-w: 100%; --csv-img-h: none; }

/* Any of the above, only inside an inline csv-view block */
.csv-inline-view .csv-table td[data-col="Character"] { min-width: 48px; }
Names match exactly, case and spaces included. Two knobs control thumbnails:
--csv-img-h caps the height (default 56px, width follows the aspect
ratio) and --csv-img-w sets the width (100%, 60%, …) — set --csv-img-h: none alongside it to switch from fit-height to fit-width.
Cell values are inserted as plain text, so HTML typed into a cell shows up as text — style the column instead. Dragging a header's right edge also resizes a column, and the width is remembered per column name.
Commands
- Add entry to current CSV — the + Add form, hotkey-able.
- Cycle view mode — steps through the file's valid views.
- Create tasks / travel / habit tracker / chart / timeline file — scaffold a new CSV preconfigured for that view.
Privacy & network use
- All data stays in your vault. No telemetry, no analytics, no network
calls — with one exception: the optional Anki sync button talks to
AnkiConnect on
localhost(127.0.0.1:8765) and only when you click it. - Per-file settings live in the plugin's
data.jsoninside your vault.
Development
npm install
npm run build        # bundle main.ts → main.js (esbuild)
npm run dev          # watch build
npm run test:all     # unit + jsdom view-smoke tests (no Obsidian needed)
npm run typecheck    # tsc --noEmit
To deploy straight into your own vault while developing, point the plugin
at it once — npm run deploy copies the built assets into local symlinks
that you create (they're gitignored):
ln -s "<your-vault>/.obsidian/plugins/datadeck" datadeck
ln -s "<second-vault>/.obsidian/plugins/datadeck" datadeck-work   # optional
npm run build:deploy
Vault-touching dev tooling reads the OBSIDIAN_VAULT environment variable
for your vault's path (no default).
main.ts holds the CardView lifecycle and plugin entry point; each view
renderer and feature lives in src/ as a free function taking the view —
the same functions power the full-page views and the embed blocks. Tests run
the renderers against a jsdom DOM with Obsidian's DOM helpers polyfilled
(test-support/); every view has smoke coverage.
See docs/ for architecture, CSS-class, and dev-workflow notes.
License
For plugin developers
Search results and similarity scores are powered by semantic analysis of your plugin's README. If your plugin isn't appearing for searches you'd expect, try updating your README to clearly describe your plugin's purpose, features, and use cases.