Bases heatmap view
pendingby Mark Serafinovsky
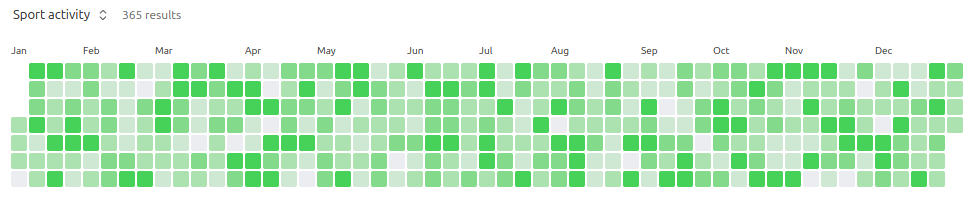
Github-style heatmap visualization for any date-based property in your Bases tables. Track activity, habits, progress, or any numeric/date-related data with color-coded squares.
Bases heatmap view
![]()
GitHub-contributions-style heatmap for any date-based property in your Bases tables. Track activity, habits, and progress with color-coded squares.
How to use
- Configure the filter to show the records you want
- Create a new view and select Heatmap
- Select the property to display on the map and adjust other settings
- You're all set

Template
This plugin is based on cookiecutter-obsidian-plugin.
License
MIT
For plugin developers
Search results and similarity scores are powered by semantic analysis of your plugin's README. If your plugin isn't appearing for searches you'd expect, try updating your README to clearly describe your plugin's purpose, features, and use cases.