Infographic
pendingby shuuul
Render AntV Infographic visualizations from fenced code blocks with source code viewing.
📊 Obsidian Infographic Plugin


Render AntV Infographic visualizations directly in your Obsidian notes using fenced code blocks. ✨
✨ Features
- 🎨 200+ Built-in Templates - Process flows, timelines, hierarchies, charts, and more
- 📝 Dual Syntax Support - Use JSON configuration or AntV's declarative DSL
- 🖼️ PDF Support - Fully compatible with Obsidian's Export to PDF feature
- 🌓 Theme Support - Auto-detect or force light/dark mode
- 📐 Responsive Design - Automatic resize handling
- 🔄 Live Reload - Refresh all infographics with a single command
📦 Installation
🧪 Install via BRAT (Beta)
For beta/development versions, install using BRAT:
- Install BRAT from Community Plugins
- Go to Settings → BRAT → Add Beta Plugin
- Enter the repository URL:
https://github.com/shuuul/obsidian-infographic - BRAT will download and keep the plugin updated
- Enable Infographic from Community Plugins
Manual Installation
- Download the latest release from GitHub Releases:
main.jsmanifest.jsonstyles.css
- Create folder:
Vault/.obsidian/plugins/obsidian-infographic/ - Place the downloaded files in the folder
- Reload Obsidian and enable the plugin
🚀 Usage
Create an infographic using a fenced code block with the infographic language:
JSON Format
{
  "template": "list-row-simple-horizontal-arrow",
  "data": {
    "items": [
      { "label": "Step 1", "desc": "Start" },
      { "label": "Step 2", "desc": "In Progress" },
      { "label": "Step 3", "desc": "Complete" }
    ]
  }
}
DSL Format
infographic list-row-simple-horizontal-arrow
data
  items
    - label Step 1
      desc Start
    - label Step 2
      desc In Progress
    - label Step 3
      desc Complete
📋 Template Examples
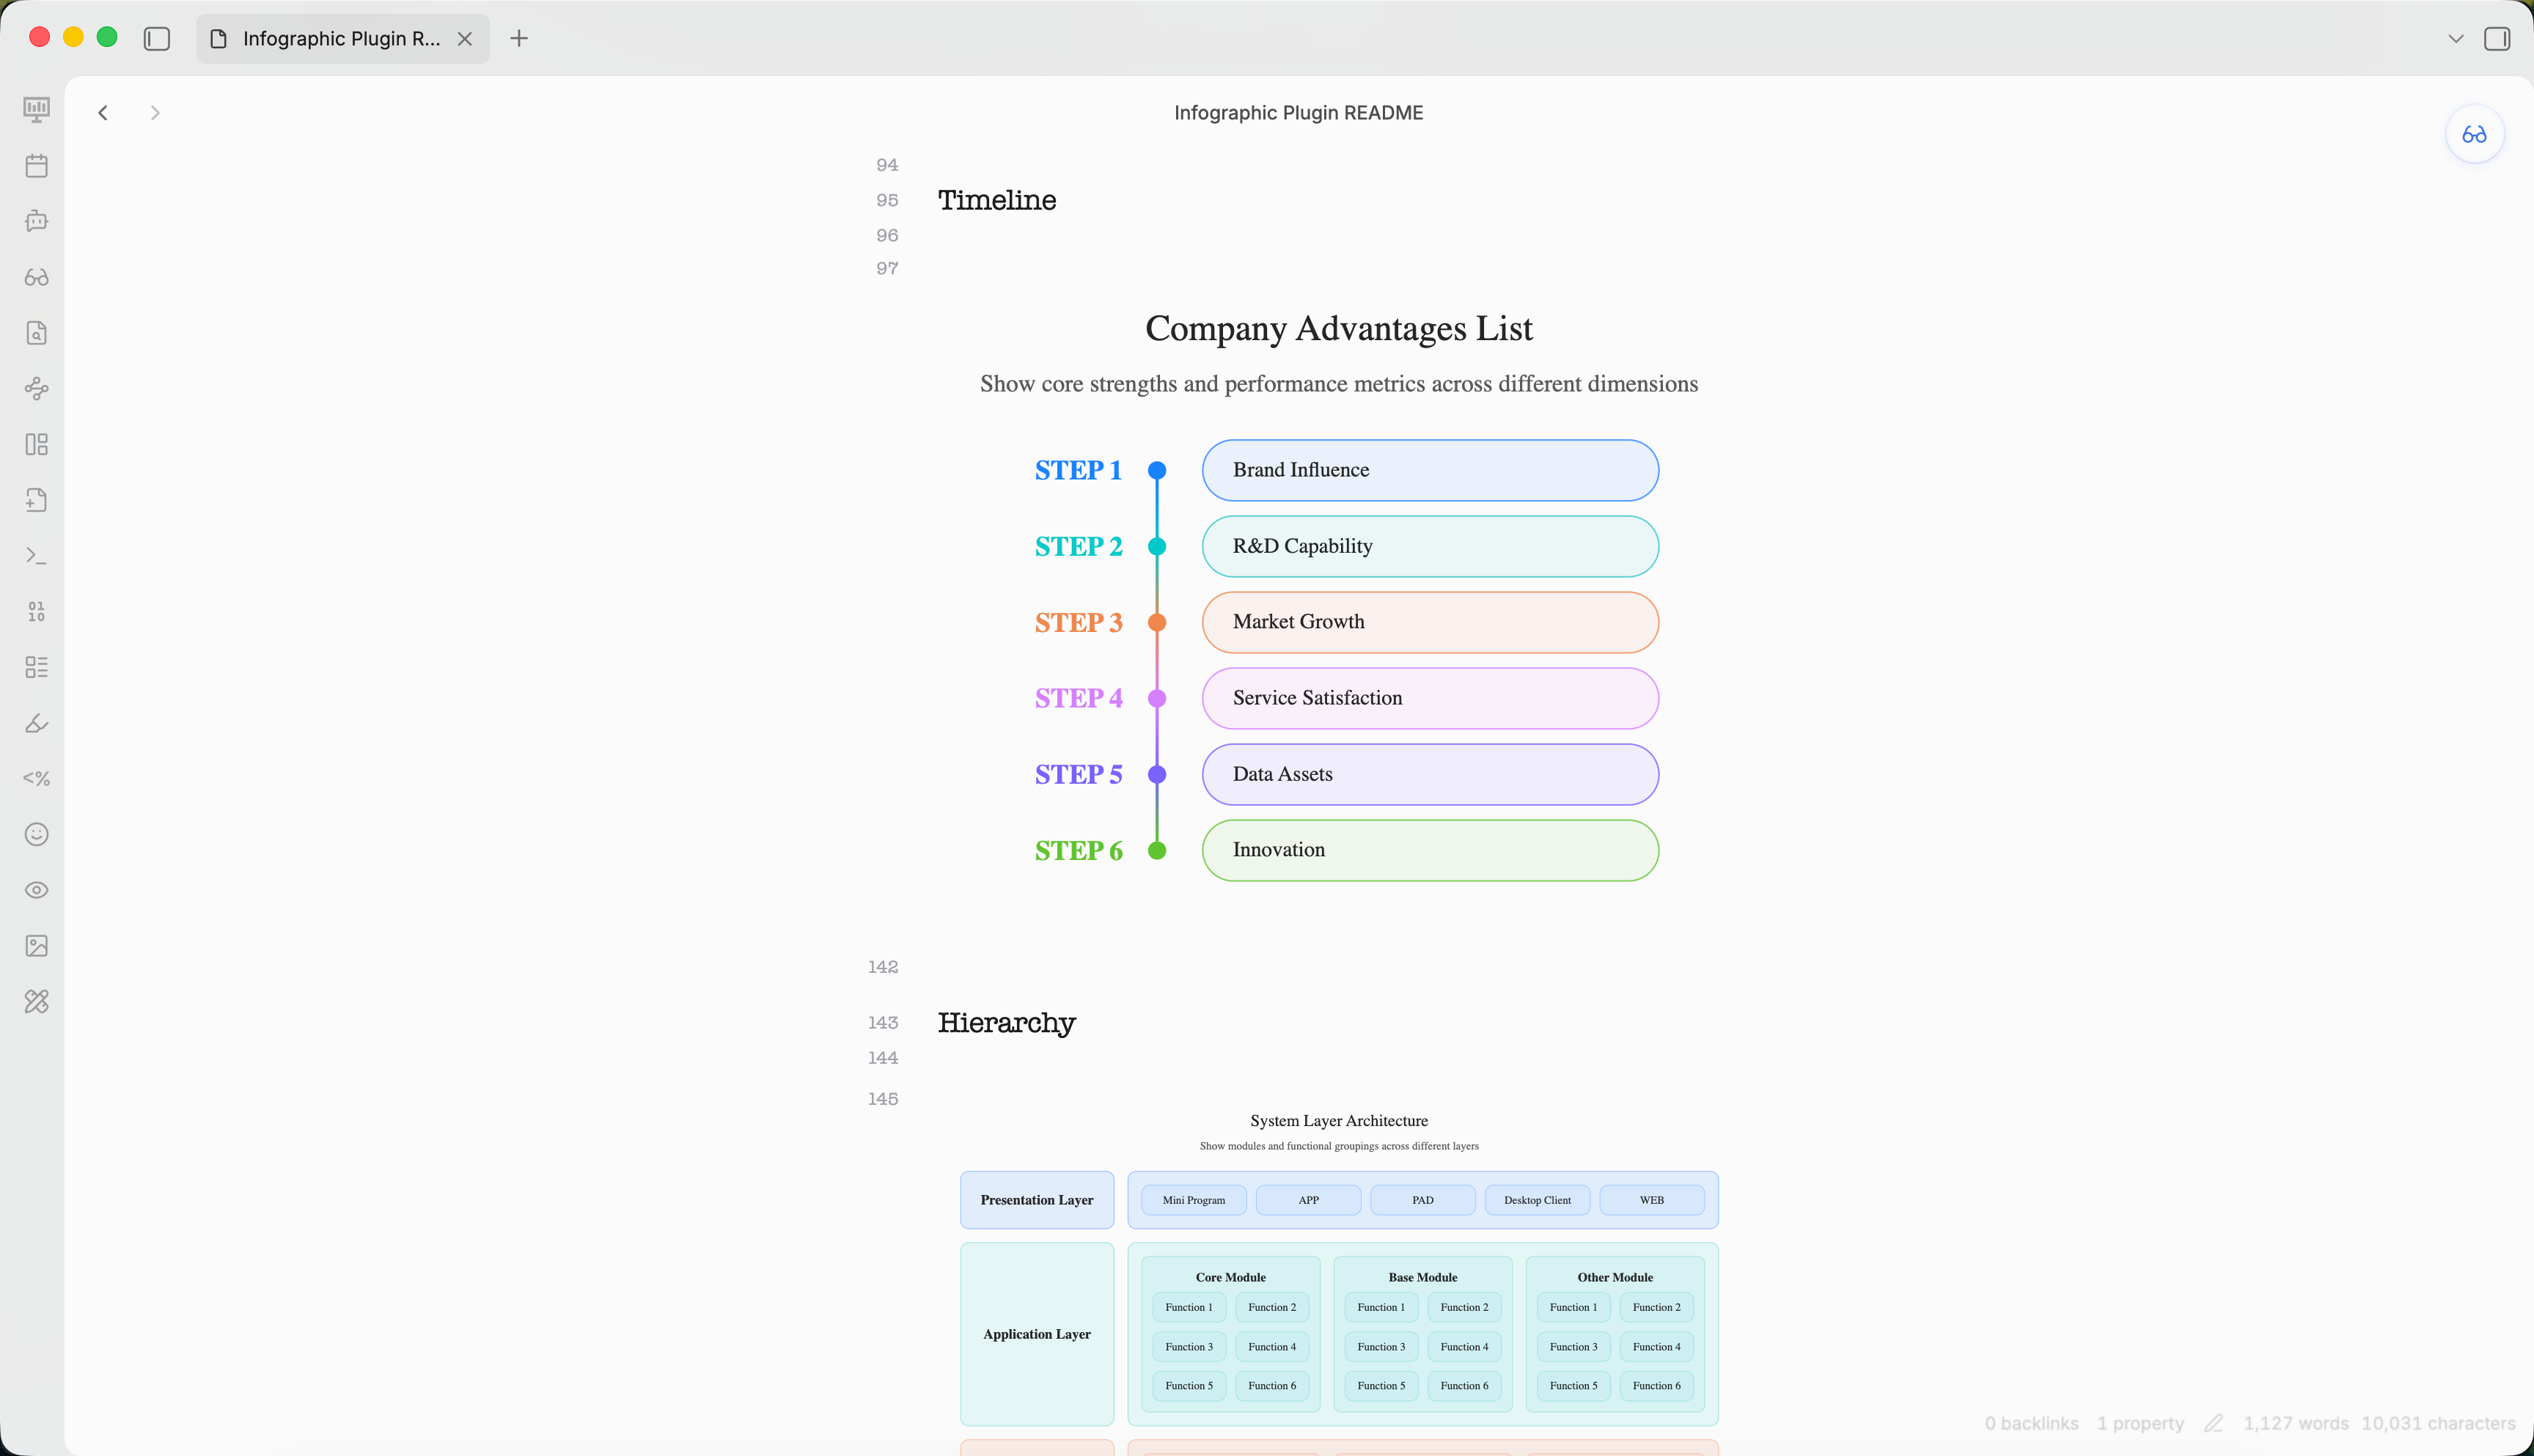
Timeline
infographic sequence-timeline-rounded-rect-node
data
  title Company Advantages List
  desc Show core strengths and performance metrics across different dimensions
  items
    - label Brand Influence
      value 85
      desc Strong recognition and trust among target users
      time 2021
      icon mingcute/diamond-2-fill
      illus creative-experiment
    - label R&D Capability
      value 90
      desc Proprietary core systems with continuous innovation
      time 2022
      icon mingcute/code-fill
      illus code-thinking
    - label Market Growth
      value 78
      desc Rapid user base growth in the past year
      time 2023
      icon mingcute/wallet-4-line
      illus business-analytics
    - label Service Satisfaction
      value 88
      desc High ratings for overall service system
      time 2020
      icon mingcute/happy-line
      illus feeling-happy
    - label Data Assets
      value 92
      desc Complete user tagging and profiling system
      time 2022
      icon mingcute/user-4-line
      illus mobile-photos
    - label Innovation
      value 83
      desc New product launches exceed industry average
      time 2023
      icon mingcute/rocket-line
      illus creativity
theme light
  palette antv
Hierarchy
infographic hierarchy-structure
data
  title System Layer Architecture
  desc Show modules and functional groupings across different layers
  items
    - label Presentation Layer
      children
        - label Mini Program
        - label APP
        - label PAD
        - label Desktop Client
        - label WEB
    - label Application Layer
      children
        - label Core Module
          children
            - label Function 1
            - label Function 2
            - label Function 3
            - label Function 4
            - label Function 5
            - label Function 6
        - label Base Module
          children
            - label Function 1
            - label Function 2
            - label Function 3
            - label Function 4
            - label Function 5
            - label Function 6
        - label Other Module
          children
            - label Function 1
            - label Function 2
            - label Function 3
            - label Function 4
            - label Function 5
            - label Function 6
    - label Platform Layer
      children
        - label Module 1
          children
            - label Function 1
            - label Function 2
            - label Function 3
            - label Function 4
        - label Module 2
          children
            - label Function 1
            - label Function 2
            - label Function 3
            - label Function 4
        - label Module 3
          children
            - label Function 1
            - label Function 2
            - label Function 3
            - label Function 4
theme light
  palette antv
Comparison
infographic compare-binary-horizontal-badge-card-fold
data
  title Company Strengths vs Weaknesses
  desc Present core strengths and areas for improvement in the market
  items
    - label Strengths
      children
        - label Strong R&D
          desc Technology leadership with independent innovation
        - label High Customer Retention
          desc Over 60% repurchase rate, good reputation
        - label Complete Service System
          desc Fast after-sales response, high satisfaction
    - label Weaknesses
      children
        - label Weak Brand Exposure
          desc Insufficient marketing, awareness needs improvement
        - label Limited Channel Coverage
          desc Incomplete online channel layout
        - label High Operating Costs
          desc Labor and logistics costs above industry average
theme light
  palette antv
Chart
infographic chart-bar-plain-text
data
  title Annual Revenue Growth
  desc Compare recent three years and current year targets (unit: 100M yuan)
  items
    - label 2021
      value 120
      desc Initial transformation, steady exploration
      icon lucide/sprout
    - label 2022
      value 150
      desc Platform optimization, significant efficiency gains
      icon lucide/zap
    - label 2023
      value 190
      desc Deep digital integration, comprehensive growth
      icon lucide/brain-circuit
    - label 2024
      value 240
      desc Expand ecosystem collaboration, aim for new highs
      icon lucide/trophy
theme light
  palette antv
⚙️ Configuration
Access settings via Settings → Community plugins → Infographic.
| Setting | Description | Default |
|---|---|---|
| Auto render | Automatically render in preview mode | true |
| Theme | Auto / Light / Dark | auto |
| Error behavior | show-code / show-error / hide | show-code |
| Max width | Maximum width (px) | 800 |
| Max height | Maximum height (px) | 600 |
Toolbar Actions
Each rendered infographic shows a toolbar:
- Copy - Copy source code to clipboard
- Export - Save as SVG or PNG
- PDF Export - Compatible with Obsidian's built-in Export to PDF
🤖 Agent Skill
This plugin is also available as an Agent Skill for creating AntV Infographic visualizations in Obsidian.
Skill Location
skills/obsidian-infographics/
├── SKILL.md              # Skill definition and usage guide
└── reference/
    └── GALLERY.md        # Complete template catalog with examples
Usage in Agents
When used as a skill, AI agents can generate AntV Infographic visualizations by outputting infographic code blocks in Obsidian markdown:
infographic list-row-simple-horizontal-arrow
data
  items
    - label Step 1
      desc Start
    - label Step 2
      desc In Progress
    - label Step 3
      desc Complete
Available Templates (200+)
| Category | Templates |
|---|---|
| Lists | list-row-simple-horizontal-arrow, list-row-simple-horizontal, list-column, list-grid, list-pyramid |
| Sequences | sequence-horizontal, sequence-timeline, sequence-roadmap, sequence-steps |
| Comparison | compare-binary, compare-swot |
| Hierarchy | hierarchy-tree, hierarchy-structure |
| Charts | chart-bar, chart-column, chart-line, chart-pie |
| Quadrant | quadrant-simple, quadrant-quarter |
| Relations | relation-circle, relation-dagre |
See Template Gallery for complete examples.
🛠️ Development
# Install dependencies
npm install

# Development build (watch mode)
npm run dev

# Production build
npm run build

# Lint
npm run lint
📄 License
Licensed under the Apache License, Version 2.0. See LICENSE for details.
For plugin developers
Search results and similarity scores are powered by semantic analysis of your plugin's README. If your plugin isn't appearing for searches you'd expect, try updating your README to clearly describe your plugin's purpose, features, and use cases.