Timeline for Bases
approvedby Harry Brown
Plots dated notes from a Base as dots and ranges along a zoomable, pannable time axis. - This plugin has not been manually reviewed by Obsidian staff.
Timeline
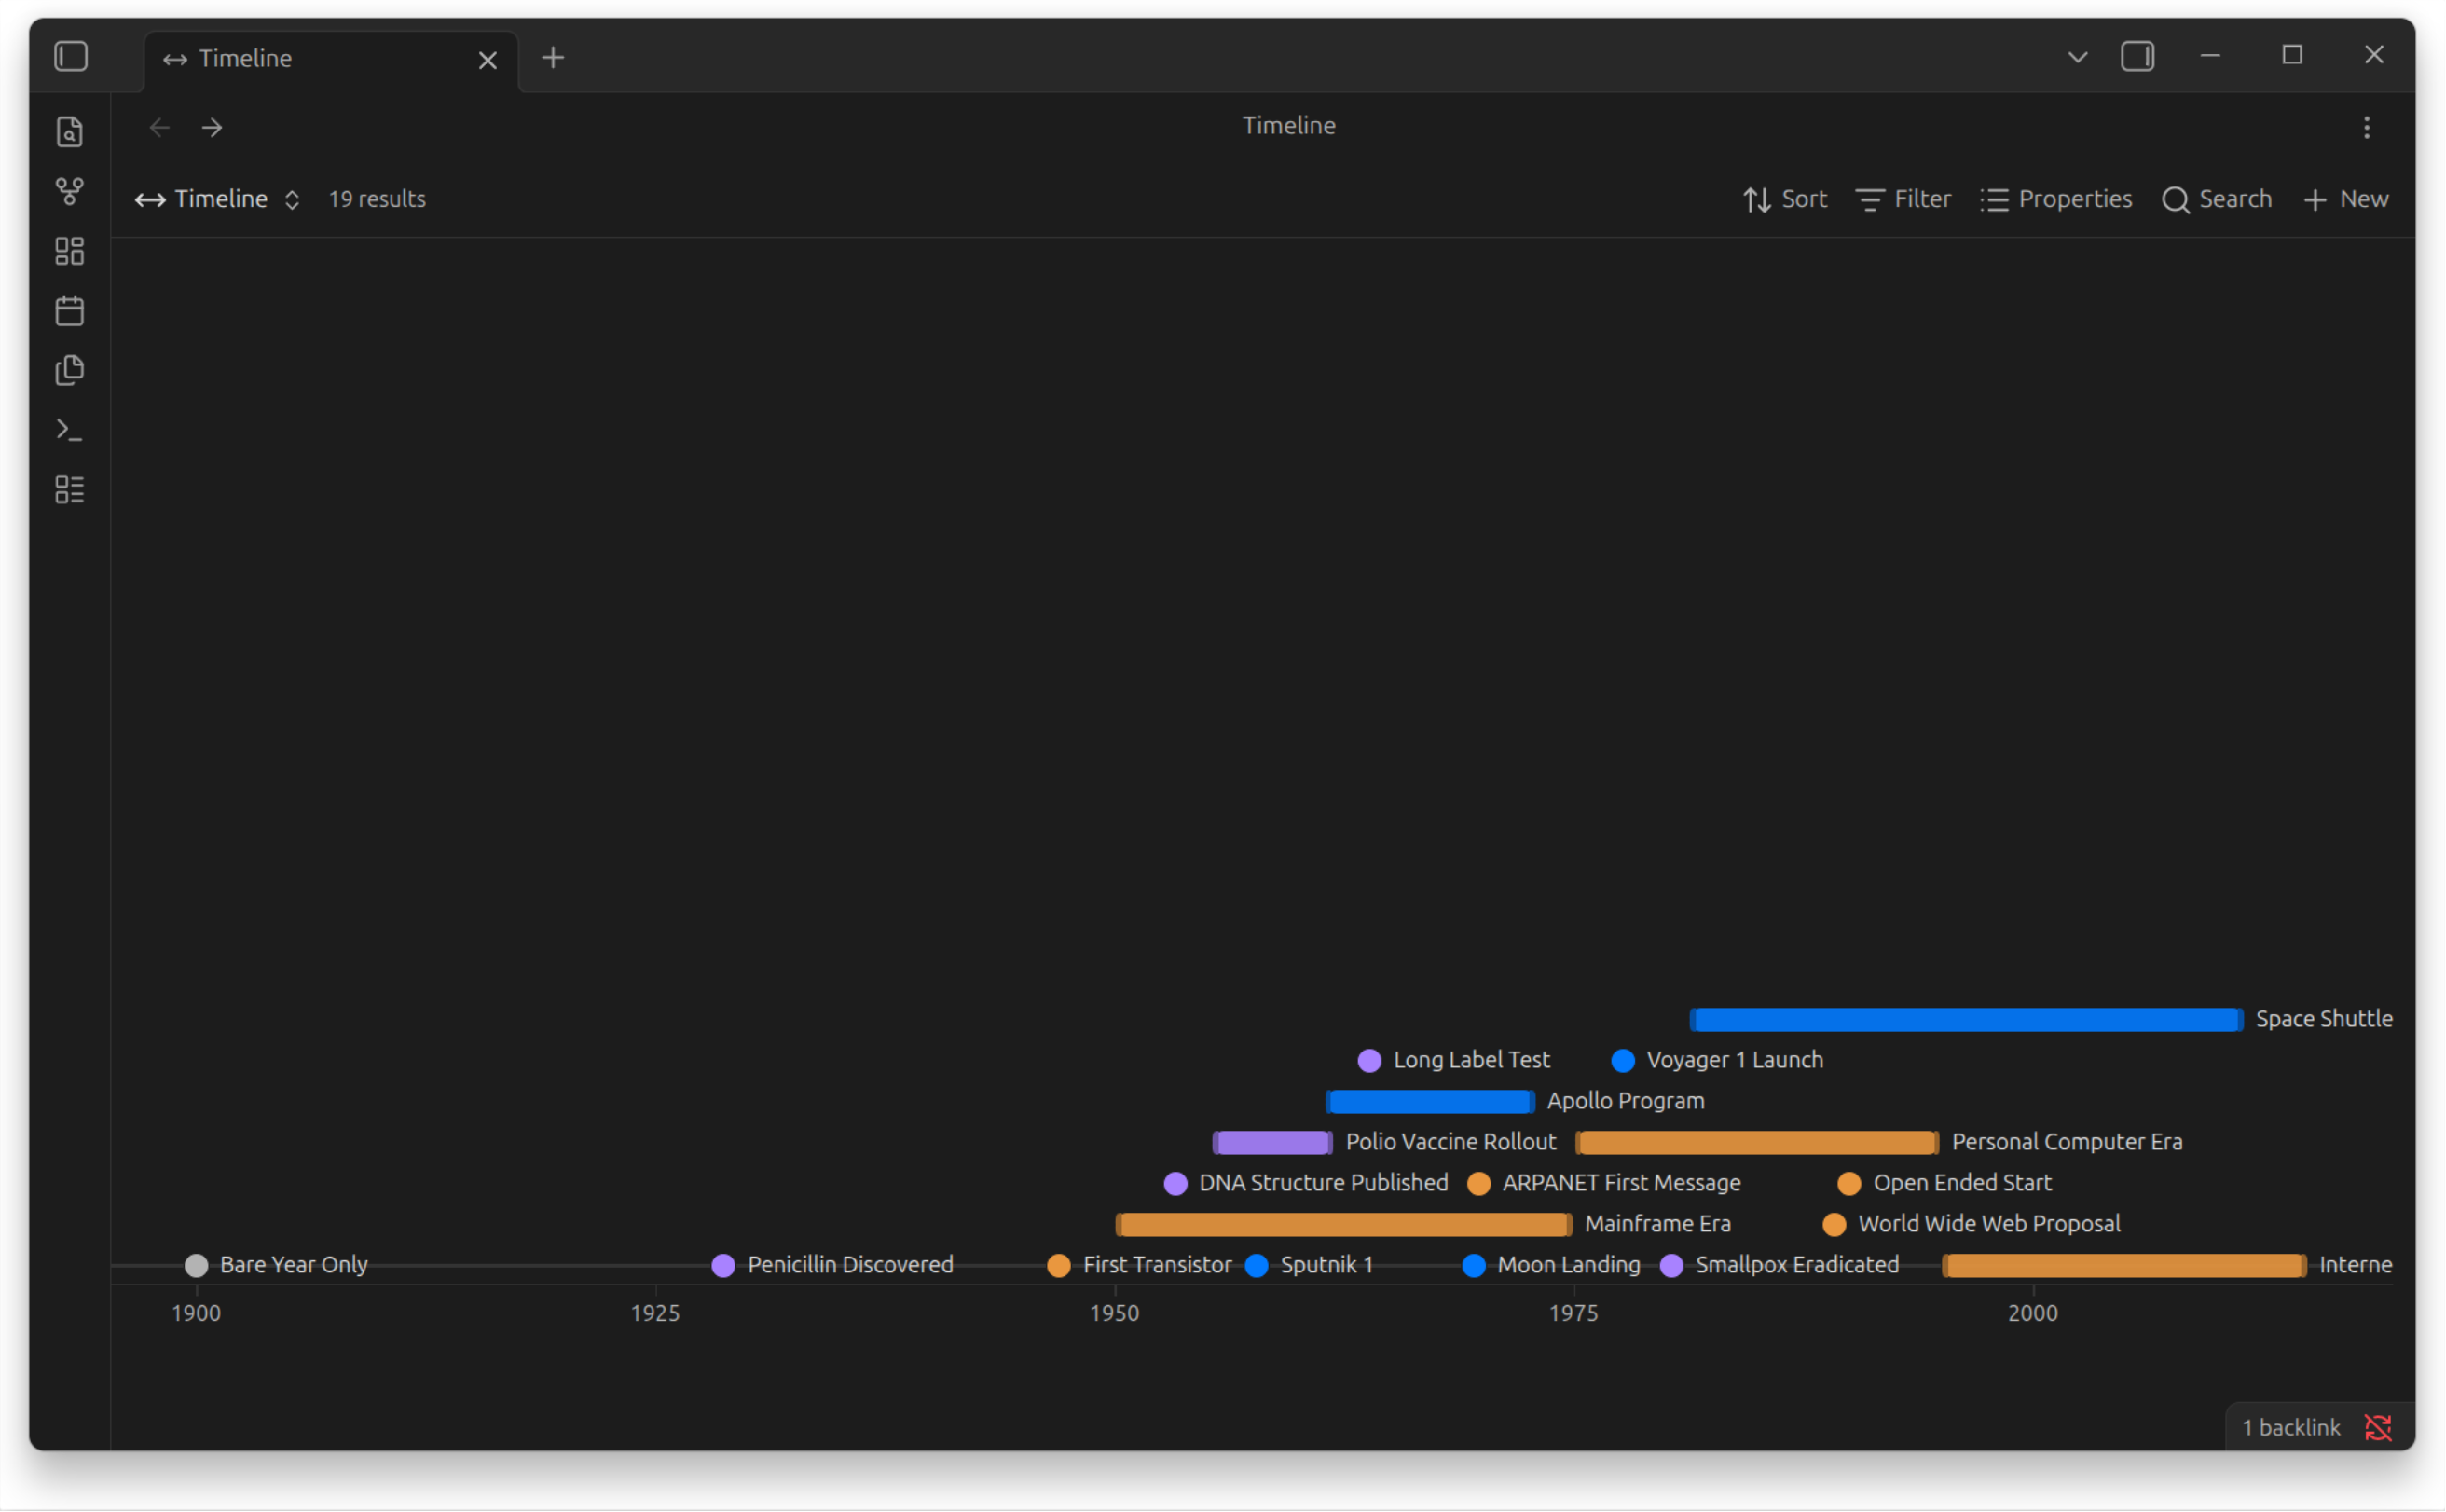
A custom Bases view for Obsidian. Notes matching a Base's filters are plotted along a horizontal, zoomable time axis, single dates as dots, date ranges as bars.
Intention
This plugin is designed as a data visualization tool for structured notes about events on a linear time scale. I use it for history notes, and lifespans of historical figures.
Usage
Create a .base file, then pick Timeline from the view switcher in the Bases toolbar.
Notes are plotted from their frontmatter:
---
date: 1969-07-20
category: War
---
---
date_start: 1961-05-25
date_end: 1972-12-19
category: War
---
A note with a start and end plots as a range bar. A note with only a single date, or only an end date, plots as a dot.
Open-ended periods
A note with a start but no usable end plots as a bar running to today, drawn without a
closing cap and faded out at its right-hand end. This covers a date_end that is absent,
present but blank, or holding a placeholder such as present, ongoing or TBD.
---
date_start: 1993
date_end:          # or omitted entirely, or "present"
category: Reign
---
The hover card reads 1993 – present. Turn Extend open periods to today off to keep
the old behaviour, where such a note plots as a dot at its start date.
An end date that parses but lands at or before the start is treated as bad data rather than as an ongoing period, and still plots as a dot.
Grouping
If the Base has a group by configured, the timeline splits into one horizontal band per group, stacked vertically and sharing a single x axis. Reigns, wars and treaties can then each occupy their own block rather than being distinguishable only by colour, which makes overlaps between them readable at a glance.
Lanes are packed per band, so a crowded group does not push a sparse one down the view. Bands with nothing dated in them are hidden rather than left as empty space. Turn Stack groups in bands off to plot every group into one band, as before.
Zooming to a period
A timeline running from 14000 BC to the present makes even a period of centuries too small to read. Rather than zooming by hand every time, pin a view to the period it is about: set Zoom start and Zoom end in the view options and save it under a name.
views:
  - type: timeline
    name: Bronze Age
    zoomStart: 3300 BC
    zoomEnd: 1200 BC
  - type: timeline
    name: Twentieth Century
    zoomStart: 1900
    zoomEnd: 1999
One Base can hold as many of these as you like, and the view switcher moves between them.
Bounds are parsed by the same code as note frontmatter, so 3300 BC, 1969-07, 1969-07-20
and a bare year all work. A year-only end covers the whole of that year: 1200 BC runs
through it rather than stopping the instant it began.
The window becomes the view's bounds, not merely its opening position — panning and zooming out both stop at it, so a view called Bronze Age is still the Bronze Age after the reader has moved around inside it. Leave either field blank to leave that edge at the extent of the data. A window that is inverted or narrower than a day is ignored rather than blanking the view, so a half-typed bound cannot leave you staring at nothing.
Mobile
Drag with one finger to pan — horizontally through time, vertically through the bands. Pinch with two fingers to zoom. Tap an item to open its note.
Dates may be full ISO dates (1969-07-20), year and month (1969-07), or a bare year
(1969). A bare year is anchored to 1 January for plotting but displays as just the year.
BC dates
BC years are supported. Write them with an era suffix or prefix:
date: 44 BC
date_start: 509 BC
date_end: AD 476
BC, BCE, AD, CE and their dotted forms are accepted, in any case, before or after the
year, as are the Romance-language a.C. (antes de Cristo, before Christ) and d.C.
(después de Cristo, after Christ). Axis ticks and hover cards render BC years as 753 BC
rather than as negatives.
For a precise BC date, use the ISO negative form, which is astronomical: it has no year
zero, so 1 BC is year 0000 and 44 BC is -0043.
date: -0043-03-15 # 15 March 44 BC
View options
| Option | Default | Purpose |
|---|---|---|
| Date property | date | Property holding a single point in time |
| Range start property | date_start | Start of a range |
| Range end property | date_end | End of a range |
| Category property | category | Drives dot and bar colour |
| Extend open periods to today | on | Plot a start with no end as a bar running to today |
| Stack groups in bands | on | Give each Bases group its own horizontal band |
| Show labels | off | Draw a text label beside each dot and bar |
| Label property | file.name | Which property the label shows |
| Axis interval (years) | auto | Years between tick labels; auto fits the zoom level |
| Show axis | on | Show or hide the axis and its labels |
| Zoom start | blank | Pin the view's left edge to a date, e.g. 3300 BC |
| Zoom end | blank | Pin the view's right edge to a date, e.g. 1200 BC |
Labels sit to the right of their dot or bar and are reserved space during lane packing, so a
label never runs over the next item. Items near the right edge carry their label on the left
instead, since the view cannot be panned past the last entry and a right-hand label there
would be clipped with no way to reach it. Any property can be used, including file
properties, so file.name shows note titles.
Colours are assigned from Obsidian's accent palette in first-seen category order, so a given category keeps its colour as filters change. Notes with no category render in grey. I'm planning to add colour selection based on tags or another variable similar to whats seen in the graph view.
License
MIT
For plugin developers
Search results and similarity scores are powered by semantic analysis of your plugin's README. If your plugin isn't appearing for searches you'd expect, try updating your README to clearly describe your plugin's purpose, features, and use cases.