Dynamic Dashboard
unlistedby Gustavo3245
Provides dynamic metrics and insights about your vault.

Dynamic Dashboard
Dynamic metrics and insights for your Obsidian vault.



See your vault at a glance. Track writing activity, file statistics, tags, recent changes, and more—directly inside Obsidian.
Preview
Dynamic Dashboard adapts its cards and insights to the available sidebar space.
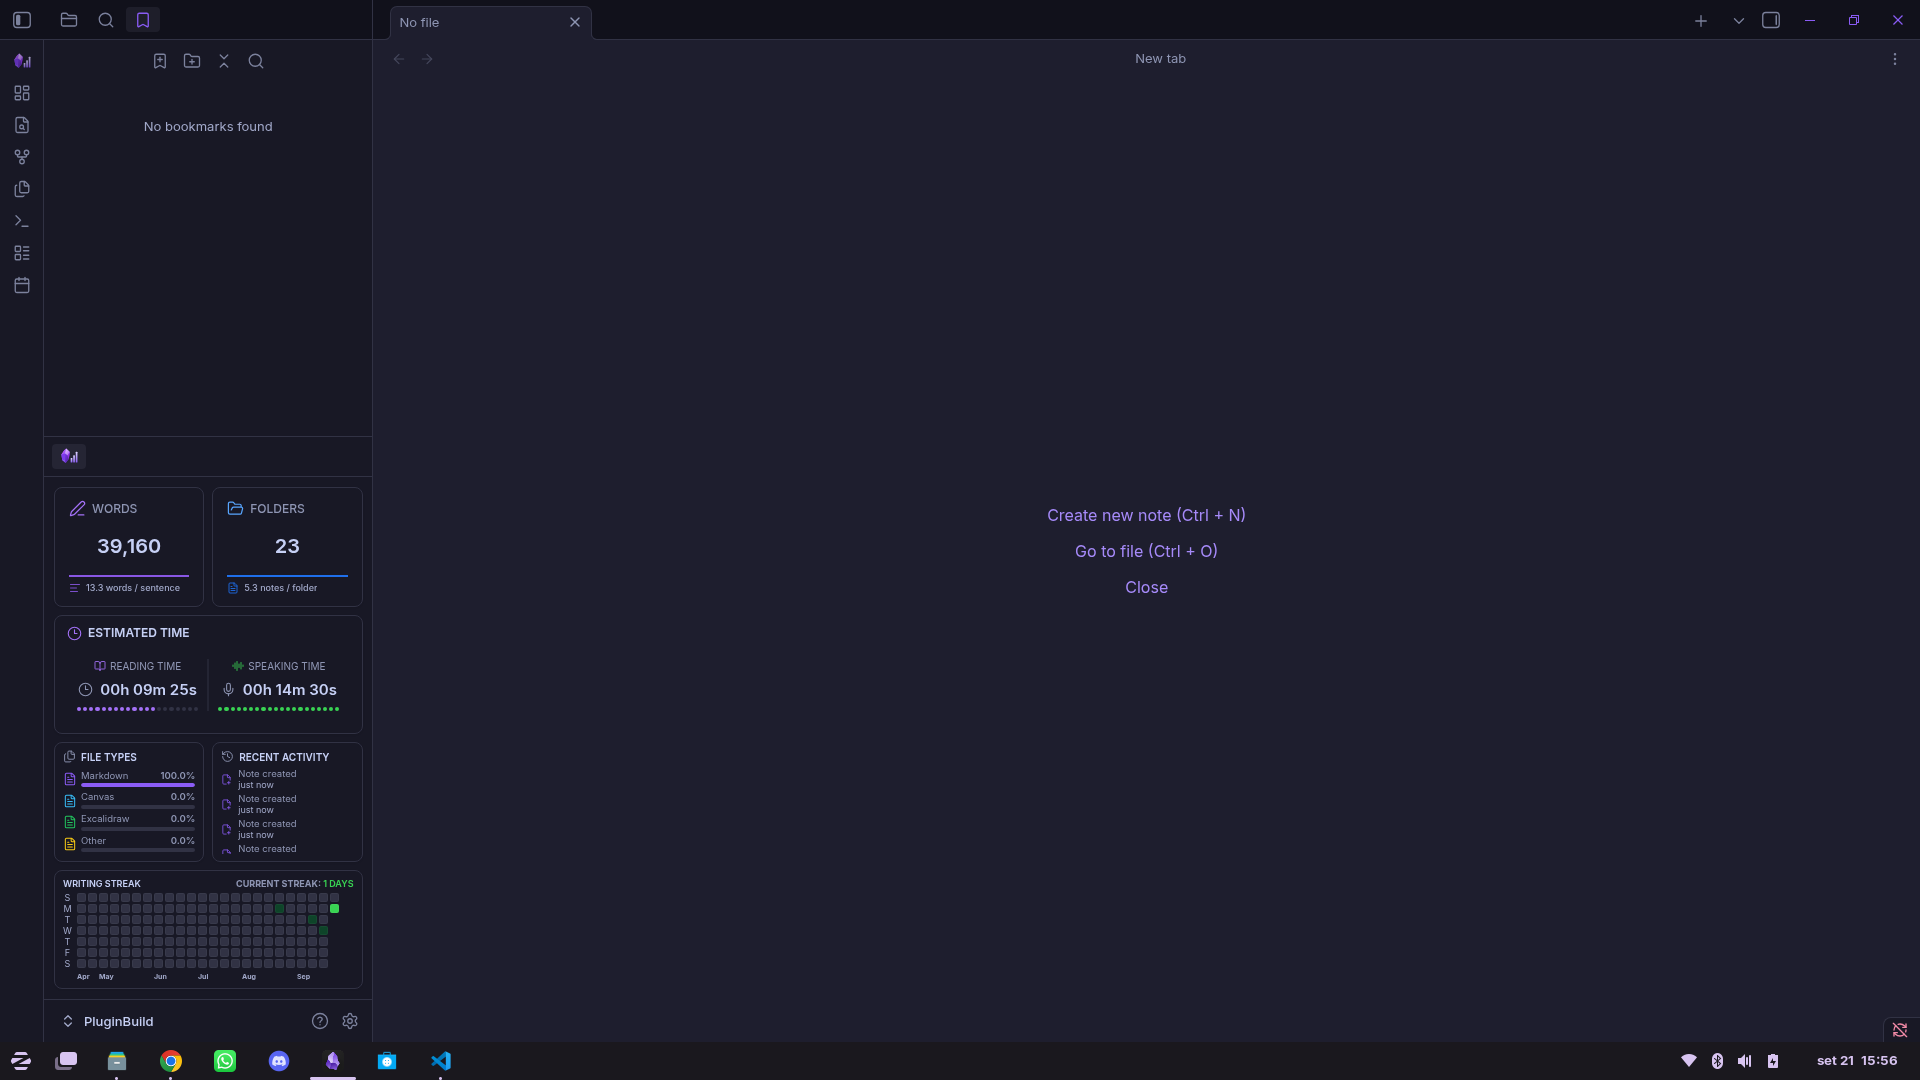
Expanded sidebar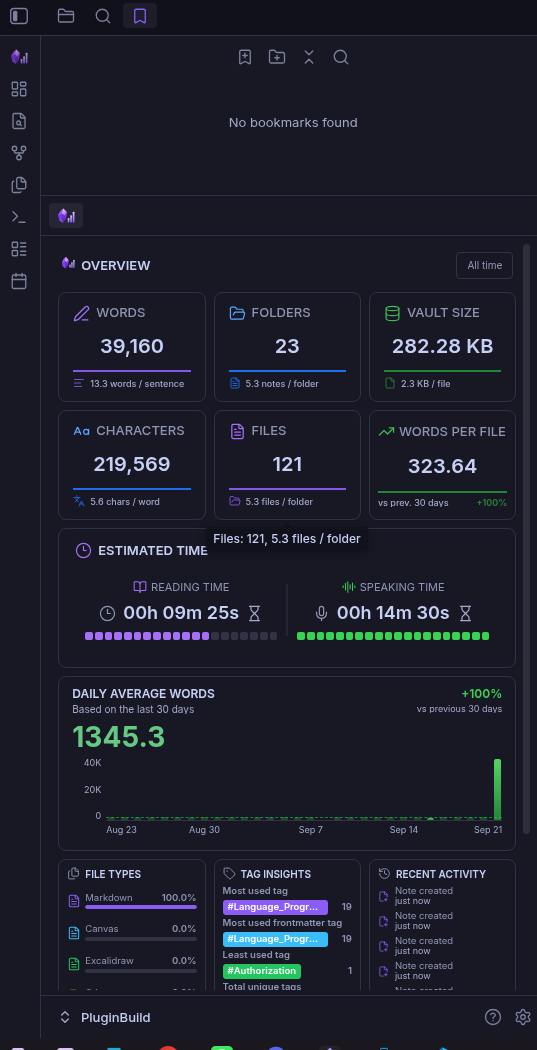 | Compact sidebar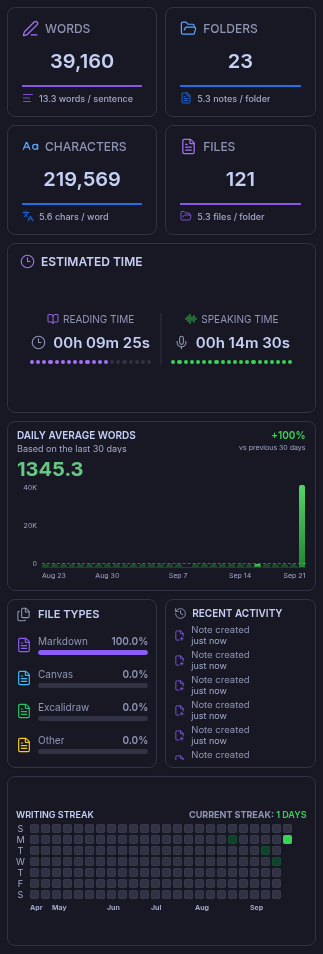 |
Features
Vault overview
- See total files, folders, vault size, words, characters, and average words per file.
- View useful derived ratios, such as words per file and files per folder.
- Estimate reading and speaking time from the current contents of your vault.
Writing activity
- Follow your daily average words with a 30-day bar chart and comparison to the preceding 30 days.
- Visualize writing consistency with a responsive Writing Streak calendar.
- Track daily words, characters, sentences, sessions, and active time in the plugin's local data.
Insights at a glance
- Explore file types and their relative share of the vault.
- Find the most-used tag, most-used frontmatter tag, least-used tag, and total unique tags.
- Review recent note activity, the most active folder, and recently modified notes.
Vault rankings
- Identify the five folders with the most files.
- Find the five notes with the highest character count.
- Access focused Vault, Tag, and Recent Activity insight cards from the full dashboard.
Adaptive dashboard
- Use a compact dashboard in the left sidebar or move it into the main workspace for the complete layout.
- Cards and charts adapt to the available space while preserving the information that matters most.
Installation
Dynamic Dashboard requires Obsidian Desktop 1.6.6 or later. Mobile is not supported.
Community Plugins
Once Dynamic Dashboard is available in the Community Plugins directory:
- Open Settings → Community plugins in Obsidian.
- Turn off Restricted mode, if necessary.
- Select Browse, search for Dynamic Dashboard, then choose Install.
- Enable the plugin after installation.
Manual installation
- Download the latest release from the Releases page.
- In your vault, create the folder
.obsidian/plugins/dynamic-dashboard/if it does not already exist. - Copy
main.js,manifest.json, andstyles.cssfrom the release into that folder. - Restart Obsidian, then enable Dynamic Dashboard under Settings → Community plugins.
Privacy
Dynamic Dashboard is local-first by design.
- All metrics are calculated locally from the files and metadata already available in your vault.
- The plugin does not send note contents, file names, tags, usage data, or metrics to external servers.
- It has no account system, telemetry, analytics service, cloud sync, or external API dependency.
- Its saved dashboard state is stored only in Obsidian's local plugin data for your vault.
Your notes remain in your vault and under your control.
Support
Please consider supporting the plugin. There are many hours of work and effort behind it. The two easiest ways to support the plugin are either by starring ⭐ the repository or by donating any amount on Ko-fi ❤️. Thank you!

Contributing
Contributions are welcome.
- Report bugs or suggest improvements through GitHub Issues.
- Before opening a pull request, keep the change focused and run
npm run buildandnpm run lint. - For larger ideas or changes to metrics, please open an issue first so the approach can be discussed.
Work in progress
Dynamic Dashboard is actively being developed. The current release already provides the dashboard, metrics, and local tracking described above, while several areas are still evolving:
- More dashboard actions and navigation from insight cards.
- Additional metrics, visual refinements, and responsive layout improvements.
- Continued improvements to refresh behavior and historical activity tracking.
Feedback, bug reports, and feature requests are especially welcome while these features take shape.
License
Dynamic Dashboard is released under the 0-BSD License.
For plugin developers
Search results and similarity scores are powered by semantic analysis of your plugin's README. If your plugin isn't appearing for searches you'd expect, try updating your README to clearly describe your plugin's purpose, features, and use cases.