Bases Chart Views
pendingby Haiqiang Zhang
Interactive chart views and AI charts for Bases, powered by Apache ECharts.
Bases Chart Views
Data Charts + AI Charts for Obsidian Bases
An Obsidian plugin that adds interactive chart views to Bases, powered by Apache ECharts. Build data-driven charts manually or generate any ECharts visualization with AI via Claudian.
Design Philosophy
This plugin offers two fundamentally different approaches to charting:
- Data Charts — Each supported chart type is carefully crafted with purpose-built controls for aggregation, grouping, axis configuration, and interactivity. Rather than exposing the full complexity of ECharts, we focus on polishing a curated set of chart types and gradually expanding support.
- AI Chart — Fully AI-driven. You simply describe what you want in a conversation with Claudian, and it handles everything — reading your data, choosing the right chart type, and writing the complete ECharts configuration. No manual configuration needed.
How It Works
- Create a Base in your vault.
- Add a new view and select a chart type — either a Data Chart (Scatter, Line, Bar, Pie) or an AI Chart.
- For Data Charts, configure the X axis and Y axes in the view settings. The plugin reads your Bases data and renders charts automatically.
- For AI Charts, install Claudian first. The plugin has deep integration with Claudian — you can chat with it to generate, modify, and iterate on any ECharts visualization. See AI Chart for details.
Data Charts
Built-in chart views that visualize Bases data with configurable axes, aggregation, and grouping.
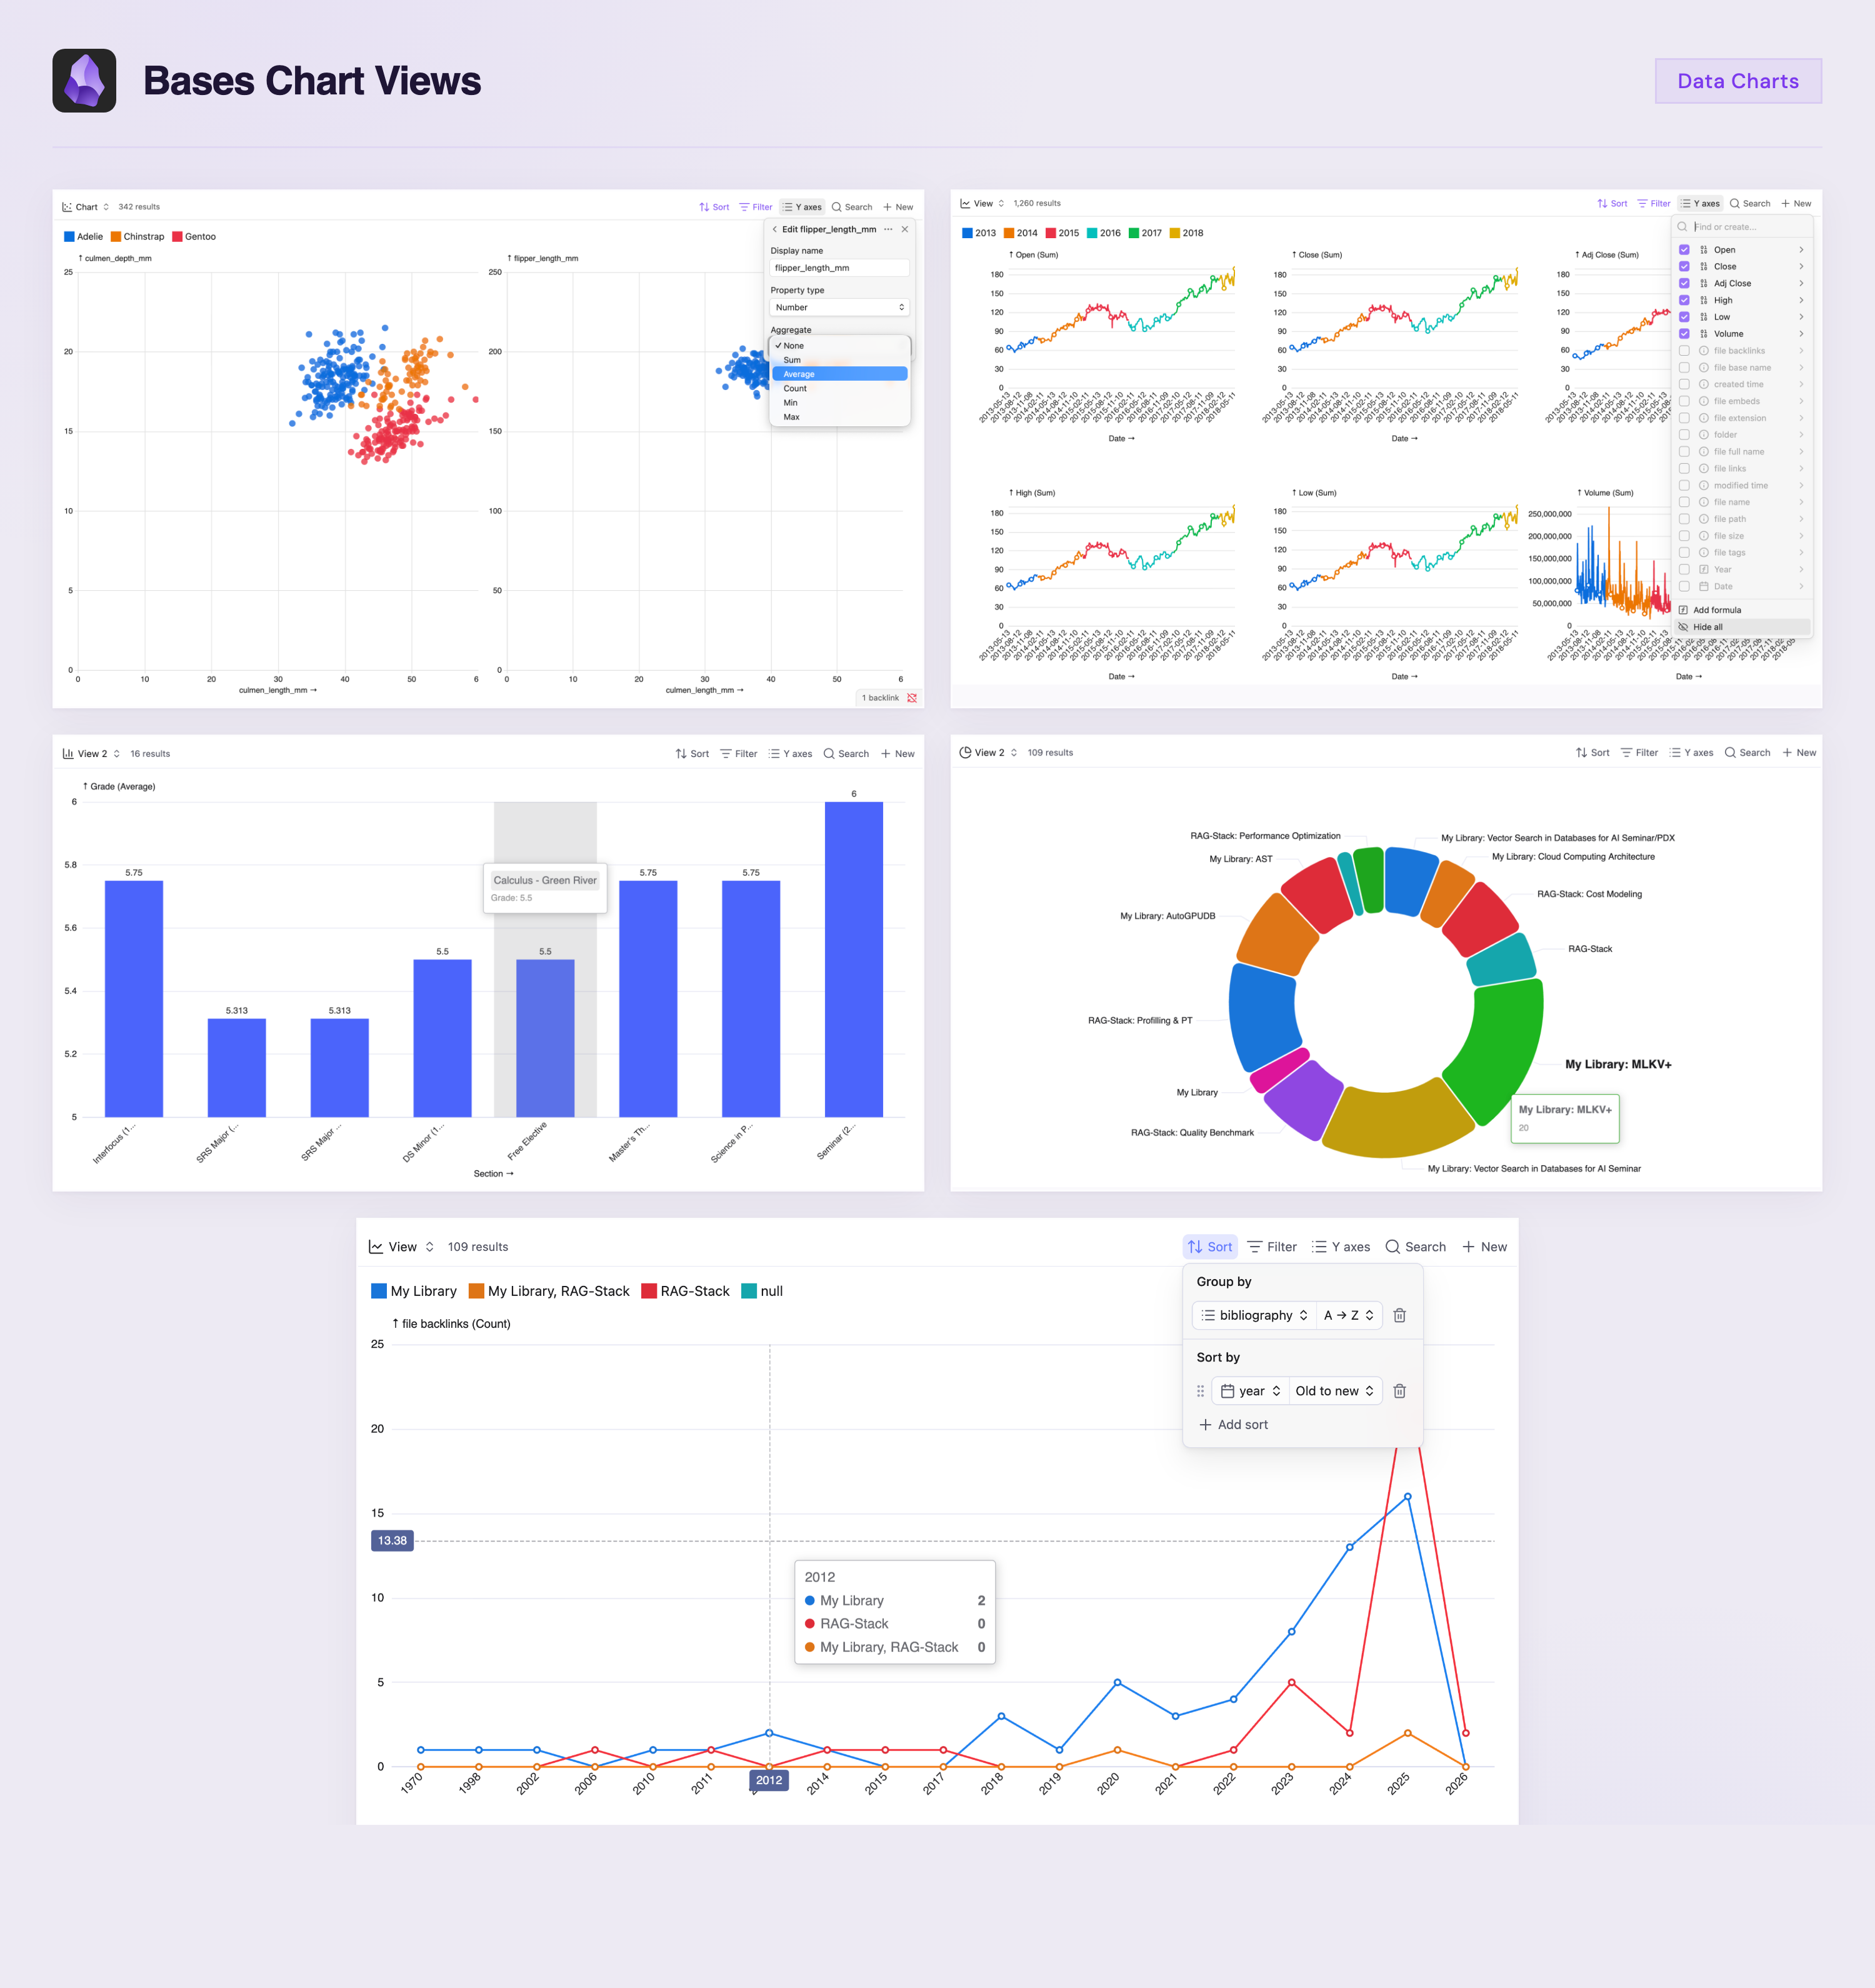
- Scatter — individual data points, optional labels, click to open source file
- Line — connected data points, configurable gap handling (Leave gap or Fill with 0)
- Bar — grouped bars with optional data labels and percentage display
- Pie — donut chart with optional labels, percentages, and null filtering
Features
- Multiple Y axes: each Y property produces a separate chart
- Per-property aggregation: set Sum, Average, Count, Min, Max (or None for Scatter) independently for each Y axis
- Sync Y axes and min/max override across charts
- Group by support: groups become colored series within each chart
- Interactive tooltips with clickable file links
- X axis sorting via Bases Sort configuration
AI Chart
Generate any ECharts visualization using Claudian. The AI Chart view supports the full ECharts option spec — line, bar, scatter, pie, radar, heatmap, treemap, sunburst, graph, sankey, gauge, funnel, candlestick, boxplot, parallel, and more.
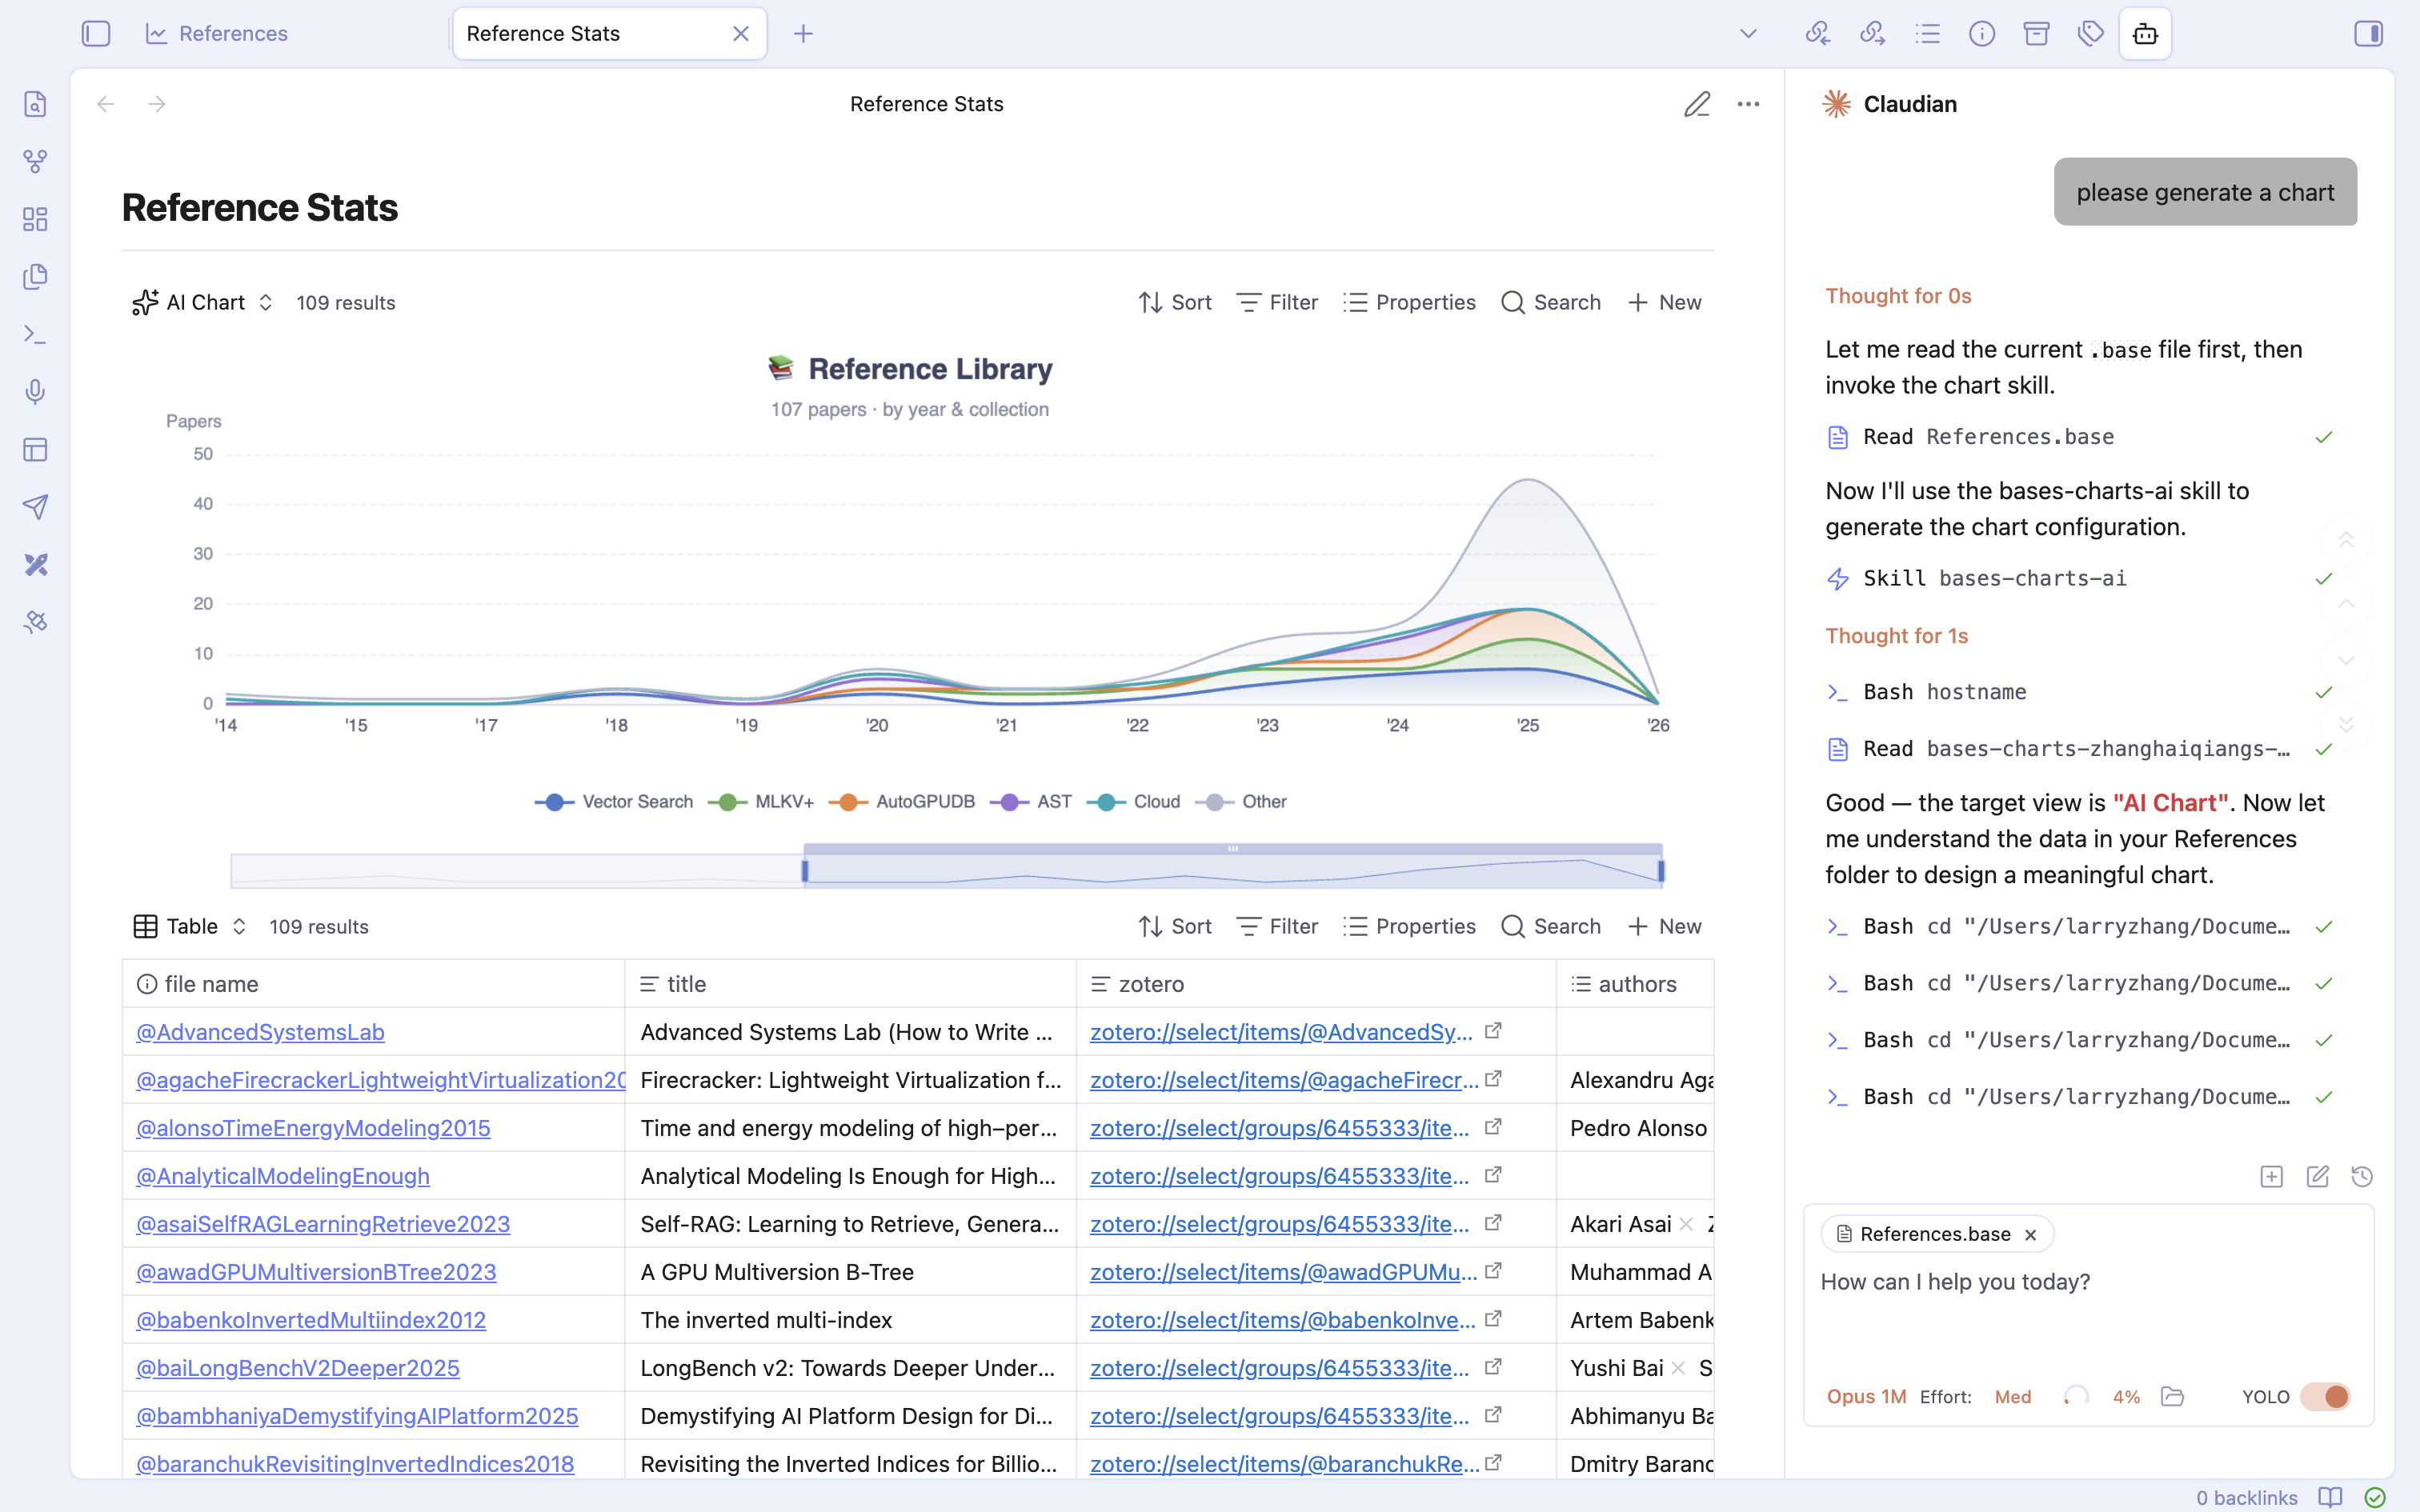
Setup
- Add an AI Chart view to your Base.
- Click Set up AI Chart to install the Claudian skill (requires Claudian).
- Ask Claudian to generate a chart — it reads your data and writes the ECharts configuration directly to the
.basefile. - The chart renders automatically. Edit via Claudian to iterate on the visualization.
General
- Auto-resize and responsive layout
- Light and dark theme support
- Mobile-optimized layout
Installation
BRAT (recommended)
- Install the BRAT plugin.
- In BRAT settings, click Add Beta Plugin.
- Enter
https://github.com/haiqiang-zhang/obsidian-bases-chartsand click Add Plugin. - Enable Bases Chart Views in Settings > Community plugins.
Manual
- Download
main.js,manifest.json, andstyles.cssfrom the latest release. - Create a folder
bases-chart-viewsin your vault's.obsidian/plugins/directory. - Copy the downloaded files into that folder.
- Enable Bases Chart Views in Settings > Community plugins.
License
Acknowledgements
This plugin started as a fork of obsidian-bases-charts-plugin by mProjectsCode, and has since been fully rewritten from scratch using native TypeScript and Apache ECharts. AI Chart is powered by Claudian.
Contributions
Contributions are always welcome. If you have an idea, feel free to open a feature request under the issue tab or create a pull request.
For plugin developers
Search results and similarity scores are powered by semantic analysis of your plugin's README. If your plugin isn't appearing for searches you'd expect, try updating your README to clearly describe your plugin's purpose, features, and use cases.