Bases Gantt
pendingby lhassa8
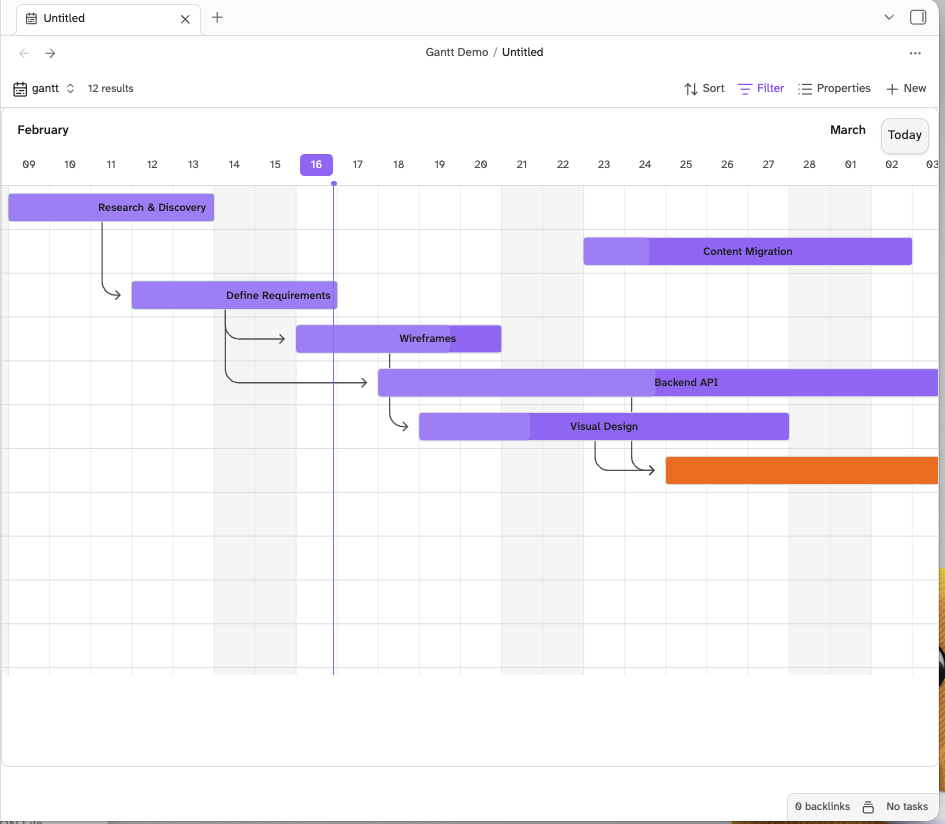
Gantt chart / timeline view for Bases. Visualize tasks with start and end dates, dependencies, and progress.
Bases Gantt
Turn your Obsidian notes into an interactive Gantt chart — drag to reschedule, track progress, visualize dependencies, and more.
Requires Obsidian 1.10.0+.
Quick Start
Step 1: Create some notes with date properties
Each note that should appear on the Gantt chart needs at least a start date in its frontmatter (the YAML block at the top of a note). An end date is optional.
For example, create a few notes in a folder:
Research.md
---
start-date: 2026-03-01
end-date: 2026-03-07
status: Done
---
Research phase of the project.
Design.md
---
start-date: 2026-03-08
end-date: 2026-03-14
status: In Progress
---
Design mockups and wireframes.
Development.md
---
start-date: 2026-03-15
end-date: 2026-03-28
status: Not Started
depends-on: "[[Research]], [[Design]]"
---
Build the thing.
Tip: You can add frontmatter to any note by typing
---at the very first line, adding your properties, and closing with another---.
Step 2: Open the folder as a Gantt chart
- Right-click the folder containing your notes
- Select New base from folder — this opens a structured view of all the notes inside
- At the top of the view, find the view type dropdown (it will say "Table" by default)
- Switch it to Gantt
- Your notes should appear as bars on a timeline
That's it! The plugin automatically detects which properties are dates and maps them to the chart.
Setting Up Your Notes
The Gantt chart reads frontmatter properties from your notes. Here's what it can use:
Required
| Property | What it does | Example |
|---|---|---|
| Start date | When the task begins. Without this, the note won't appear on the chart. | start-date: 2026-03-01 |
Optional
| Property | What it does | Example |
|---|---|---|
| End date | When the task ends. If omitted, defaults to 1 day after start. | end-date: 2026-03-05 |
| Progress | Completion percentage (0–100). Enables the progress bar on the task. | progress: 40 |
| Dependencies | Wiki-links to notes that must finish first. Shows arrows between bars. | depends-on: "[[Design]]" |
| Status / Priority / etc. | Any text property can be used to color-code the bars. | status: In Progress |
| Label | Override the displayed name (defaults to the file name). | label: "Phase 1 Research" |
Property names are flexible
You don't have to use the exact names above. The plugin auto-detects properties by looking for common keywords:
- Start date:
start,begin,from,created - End date:
end,due,finish,deadline,until - Progress:
progress,percent,completion,complete,done - Dependencies:
depends,blocks,after,prerequisite,requires - Color by:
status,priority,type,category,phase,stage
So due-date, deadline, finish-date, etc. all work as end dates without any configuration.
Dependencies
To link tasks with dependency arrows, add a property with wiki-links to other notes:
depends-on: "[[Task A]], [[Task B]]"
You can also use plain comma-separated names (without wiki-link brackets), but wiki-links are recommended because Obsidian will keep them updated if you rename notes.
Milestones
If a task's start and end date are the same, it renders as a milestone — a compact marker on the timeline:
---
start-date: 2026-03-15
end-date: 2026-03-15
---
Configuring the View
Click the gear icon in the view header to open the Gantt settings panel.
Properties Section
If auto-detection picks the wrong properties (or you want to override it), you can manually assign each one:
- Start date — Which date property to use as the bar's start
- End date — Which date property to use as the bar's end
- Label — Which property to use as the bar's label (defaults to file name)
- Dependencies — Which property contains dependency links
- Color by — Which property to color-code bars by (e.g.,
statusgives each status value a different color) - Progress — Which numeric property represents completion (only visible when "Show progress" is on)
Display Section
- View mode — Zoom level: Quarter Day, Half Day, Day, Week, Month, or Year
- Bar height — How tall the task bars are (16–60 pixels)
- Show progress — Toggle the progress bar overlay on tasks
- Show expected progress — When progress is shown, adds a dashed line indicating where progress should be based on how much time has elapsed
Interacting with the Chart
Drag a bar left/right
Reschedules the task — changes the start and end dates. The dates are written back to the note's frontmatter automatically.
Drag the right edge of a bar
Resizes the task — changes the end date while keeping the start date fixed.
Click a bar
Opens the note in the current tab.
Right-click a bar
Opens a context menu:
- Open note — open in current tab
- Open in new tab — open in a new tab
- Set progress — quickly set to 0%, 25%, 50%, 75%, or 100%
- Scroll to today — jump the chart to today's date
Right-click empty space
- Create new task — creates a new note with today's date
- Scroll to today
Click an empty date column
Creates a new task at that specific date.
Hover over a bar
Shows a popup with:
- Date range and duration
- Progress bar (if enabled)
- Dependencies (names of linked tasks)
- A preview of the note's content
Drag the progress handle
If "Show progress" is enabled, a small handle appears inside the bar. Drag it to change the completion percentage.
Grouping Tasks
If you configure grouping in the view (e.g., group by status), the Gantt chart reflects this with group headers — visual section bars that span the full date range of their group's tasks.
Command Palette
All commands are available via Cmd/Ctrl + P:
| Command | What it does |
|---|---|
| Gantt: Scroll to today | Jumps the chart to today's date |
| Gantt: Create new task | Creates a new note with today's date pre-filled |
| Gantt: Day view | Switch to day-level zoom |
| Gantt: Week view | Switch to week-level zoom |
| Gantt: Month view | Switch to month-level zoom |
| Gantt: Year view | Switch to year-level zoom |
Complete Example
Here's a small project with all features in use. Create these notes in a folder, then right-click the folder, select New base from folder, and switch the view to Gantt.
Planning.md
---
start-date: 2026-04-01
end-date: 2026-04-03
status: Done
progress: 100
---
Define project scope and requirements.
Design.md
---
start-date: 2026-04-04
end-date: 2026-04-08
status: Done
progress: 100
depends-on: "[[Planning]]"
---
Create wireframes and mockups.
Backend.md
---
start-date: 2026-04-09
end-date: 2026-04-18
status: In Progress
progress: 60
depends-on: "[[Design]]"
---
API and database implementation.
Frontend.md
---
start-date: 2026-04-09
end-date: 2026-04-20
status: In Progress
progress: 30
depends-on: "[[Design]]"
---
Build the UI components.
Launch.md
---
start-date: 2026-04-21
end-date: 2026-04-21
status: Not Started
progress: 0
depends-on: "[[Backend]], [[Frontend]]"
---
Ship it!
This will show:
- Planning and Design as completed bars
- Backend and Frontend running in parallel, both depending on Design
- Launch as a milestone at the end, depending on both Backend and Frontend
- Dependency arrows connecting them
- Color-coded bars if you set "Color by" to
status
Troubleshooting
I don't see a "Gantt" option in the view selector
Make sure the plugin is enabled in Settings > Community plugins. Also make sure you're running Obsidian 1.10.0 or later.
My notes don't appear on the chart
- Make sure your notes have a date property in the frontmatter (e.g.,
start-date: 2026-03-01) - Make sure the date is a valid format:
YYYY-MM-DD - Check that the correct property is selected in the gear icon settings
The chart shows "Configure a start date property"
Open the view settings (gear icon) and select which property contains your start dates. This usually means auto-detection couldn't find a date property — make sure your notes have date values, not just text.
Dates are off by one day
This can happen if date values include timezone information. Use the plain YYYY-MM-DD format (e.g., 2026-03-01) without time components for best results.
Dependency arrows aren't showing
- Make sure the dependency property uses wiki-link syntax:
depends-on: "[[Other Note]]" - The linked note must also appear on the chart (it needs a start date)
- Check that "Dependencies" is set to the correct property in view settings
Installation
Community Plugins (Recommended)
- Open Settings > Community plugins > Browse
- Search for Bases Gantt
- Click Install, then Enable
Manual
- Download
main.js,styles.css, andmanifest.jsonfrom the latest release - Create a folder called
bases-ganttinside your vault's.obsidian/plugins/directory - Place the three files in that folder
- Enable the plugin in Settings > Community plugins
Development
git clone https://github.com/lhassa8/obsidian-bases-gantt
cd obsidian-bases-gantt
npm install
npm run dev    # watch mode with source maps
npm run build  # production build
License
For plugin developers
Search results and similarity scores are powered by semantic analysis of your plugin's README. If your plugin isn't appearing for searches you'd expect, try updating your README to clearly describe your plugin's purpose, features, and use cases.